Fig. 3
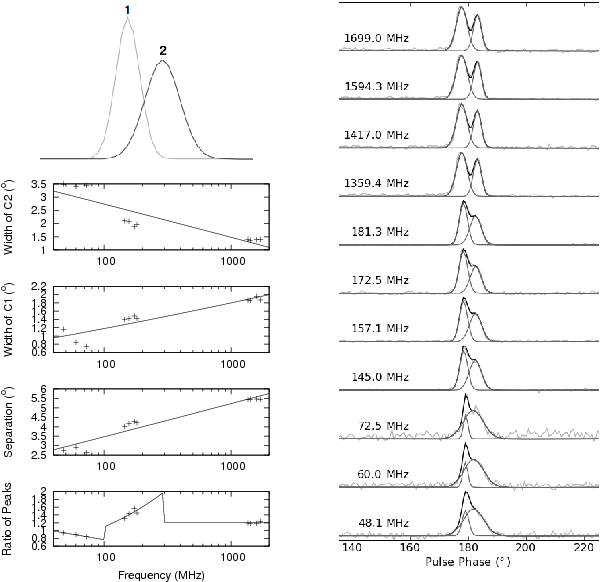
PSR B1919+21 is the simplest of our models, a double peaked pulsar. The top left panel shows the model used for the pulsar, two Gaussians with the fiducial point set as the midpoint between the peaks of each component. The Gaussians are fitted to the data using a least squares fitting algorithm, allowing their width, height and separation to vary. This fitting is shown in the right hand panel. The data is plotted in light grey, the two fitted components are plotted in dark grey, and the sum of both fitted components is plotted in black. The Gaussian parameters for each of the observations are recorded and plotted as a function of frequency in the bottom left panel. These parameters are then fitted with power laws to get a model of the pulse profile as a function of frequency. This global model is subsequently used to produce templates for cross-correlation. The “ratio of peaks” plot has discontinuities because different power laws were fitted in each observing band. PSR B1919+21 was not detected in the Effelsberg observations as the source was too weak.
Current usage metrics show cumulative count of Article Views (full-text article views including HTML views, PDF and ePub downloads, according to the available data) and Abstracts Views on Vision4Press platform.
Data correspond to usage on the plateform after 2015. The current usage metrics is available 48-96 hours after online publication and is updated daily on week days.
Initial download of the metrics may take a while.