Fig. 2
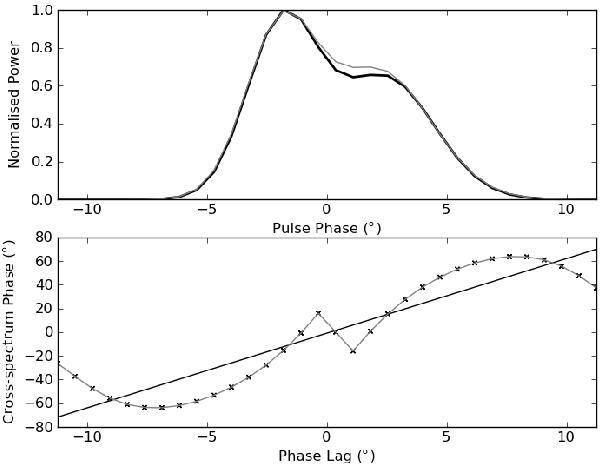
Errors in timing PSR B1919+21. The top panel shows the HBA template (black line) and the 145 MHz data (grey line). The bottom panel shows the cross-spectrum phase of the template and the profile and a straight line fit to the data (solid line). The subtle difference between the shape of the pulse profile and the template causes a gradient in the cross-correlation phase shifting the apparent TOA.
Current usage metrics show cumulative count of Article Views (full-text article views including HTML views, PDF and ePub downloads, according to the available data) and Abstracts Views on Vision4Press platform.
Data correspond to usage on the plateform after 2015. The current usage metrics is available 48-96 hours after online publication and is updated daily on week days.
Initial download of the metrics may take a while.