Fig. 11
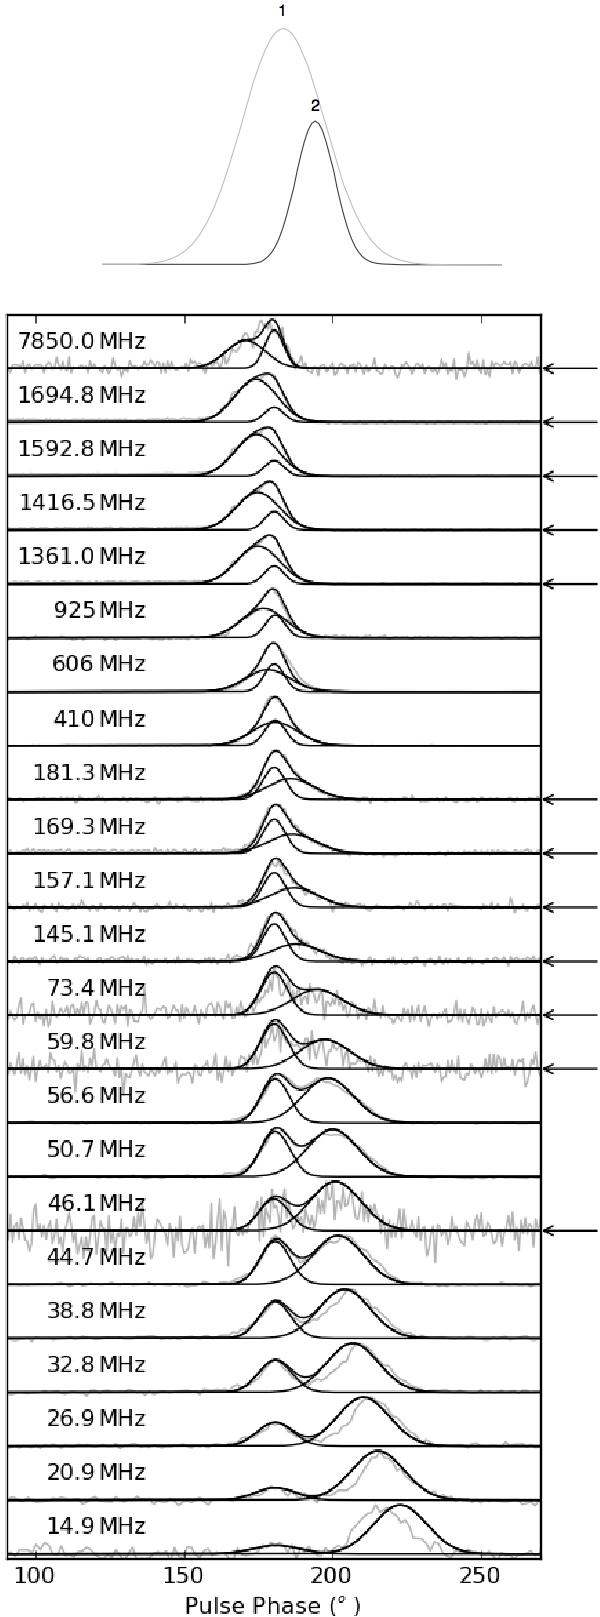
The model used to produce the dynamic template of PSR B0809+74. The model consists of two Gaussian components. The peak of the narrower component is the fiducial point of the observation and the broad component drifts through the pulse profile. The two components and the final model are plotted in black, and compared to data, which is plotted in grey. The simultaneous observations (used to create the model) are indicated by arrows. Pulse profiles at 410 MHz, 606 MHz and 925 MHz are from the EPN database and the low frequency (10–60 MHz) pulse profiles are from a recent observation with the LOFAR superterp.
Current usage metrics show cumulative count of Article Views (full-text article views including HTML views, PDF and ePub downloads, according to the available data) and Abstracts Views on Vision4Press platform.
Data correspond to usage on the plateform after 2015. The current usage metrics is available 48-96 hours after online publication and is updated daily on week days.
Initial download of the metrics may take a while.