Fig. 3
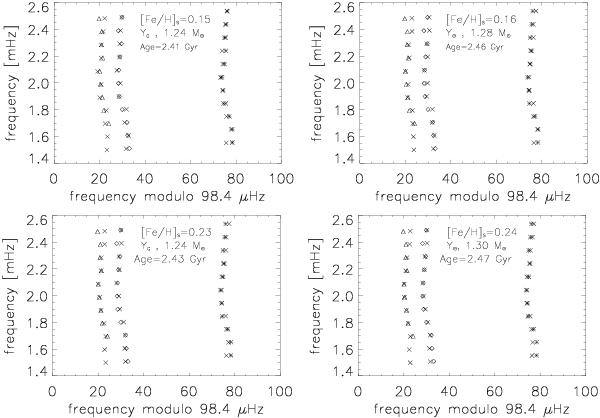
Echelle diagrams for the best-fit model found for each set of evolutionary tracks calculated with α = 1.8. In this set of models, the surface effects are not included. The model frequencies (crosses) are compared to the observed frequencies, wich are represented as diamonds (ℓ = 0), asterisks (ℓ = 1), and triangles (ℓ = 2). To obtain these best fits, we had to shift the model frequencies by respectively (top left, top right, bottom left, bottom right) 27, 25, 24, and 22 μHz (see text).


Current usage metrics show cumulative count of Article Views (full-text article views including HTML views, PDF and ePub downloads, according to the available data) and Abstracts Views on Vision4Press platform.
Data correspond to usage on the plateform after 2015. The current usage metrics is available 48-96 hours after online publication and is updated daily on week days.
Initial download of the metrics may take a while.