Fig. C.1
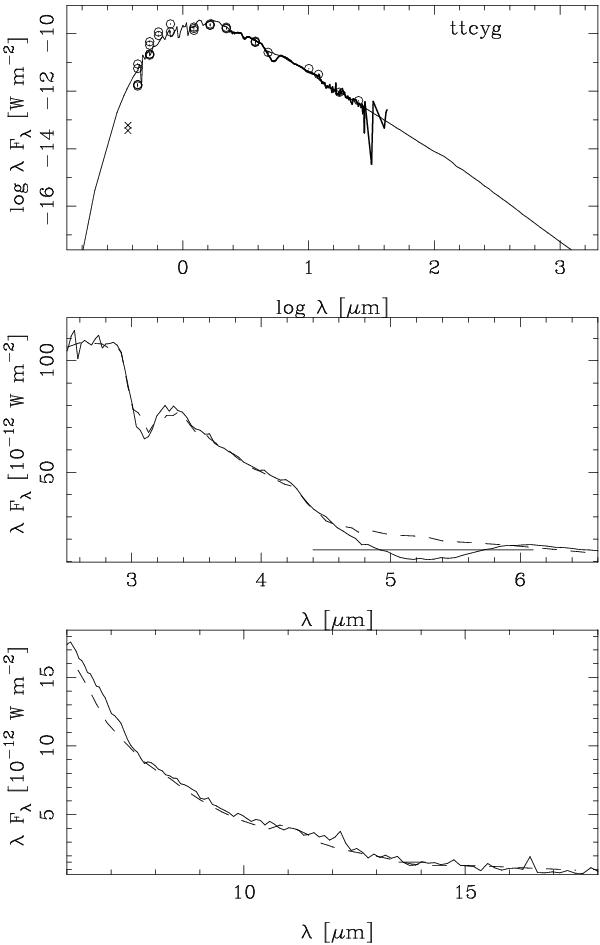
Best fit to the optical and NIR photometry and SWS spectrum of TT Cyg, with Teff = 3200 K, log g = −0.4, C/O = 1.10. The top panel shows the full SED, while the middle and lower panel show details of the SWS spectrum. The C3 feature near 5.4 μm is not well fitted in any of the Aringer et al. (2009) models and is excluded from the fit (as indictated by the line between 4.4 and 6.1 μm). This is likely related to the issue discussed in Jörgensen et al. (2000) about the parameter Kp(C3) that expresses the equilibrium between atomic carbon, C2 and C3 and that is not well known.
Current usage metrics show cumulative count of Article Views (full-text article views including HTML views, PDF and ePub downloads, according to the available data) and Abstracts Views on Vision4Press platform.
Data correspond to usage on the plateform after 2015. The current usage metrics is available 48-96 hours after online publication and is updated daily on week days.
Initial download of the metrics may take a while.