Free Access
Fig. 10
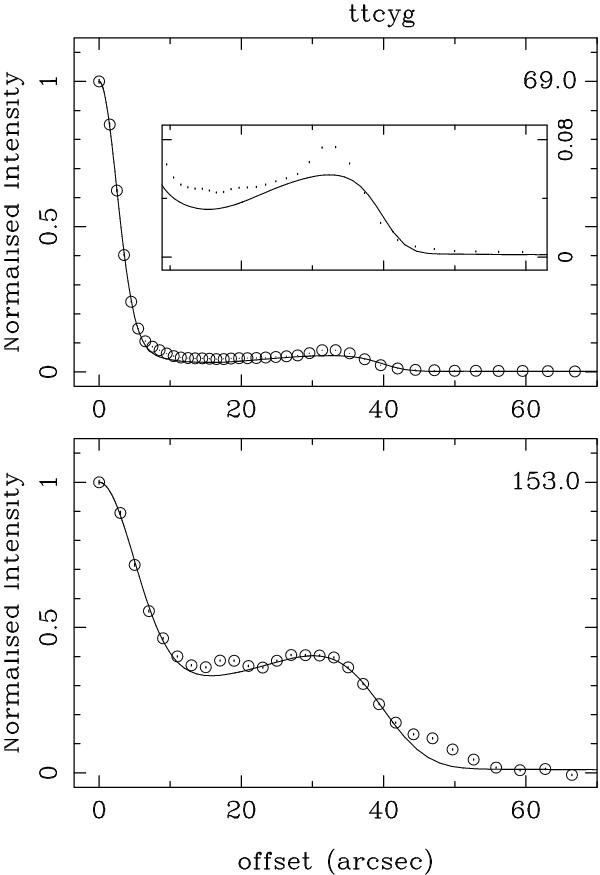
Fit to the azimuthally averaged PACS intensity distributions of TT Cyg for the model where the temperature in the detached shell is 46·r-0.4. The wavelength is listed in the top right corner of each panel. The inset shows the outer low-intensity part in more detail.
Current usage metrics show cumulative count of Article Views (full-text article views including HTML views, PDF and ePub downloads, according to the available data) and Abstracts Views on Vision4Press platform.
Data correspond to usage on the plateform after 2015. The current usage metrics is available 48-96 hours after online publication and is updated daily on week days.
Initial download of the metrics may take a while.