Fig. 7
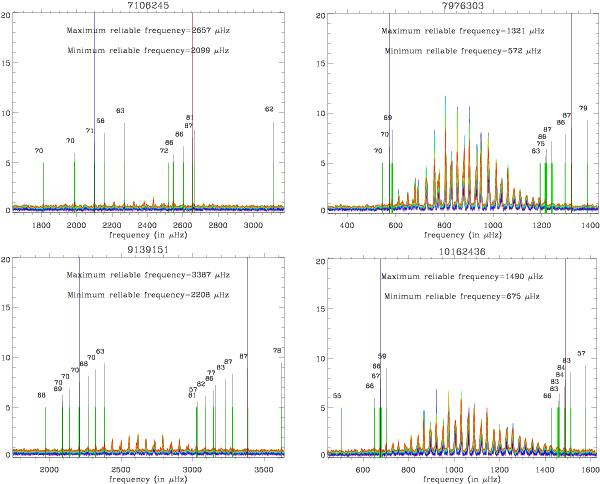
Smoothed power spectrum normalised to the detection xdet as a function of frequency for several smoothing factor values (several colours; the redder and the higher the smoothing factor) for four stars (KIC 7106245, KIC 7976303, KIC 9139151, KIC 10162436). The short vertical black lines show the minimum and maximum frequency detected with a single smoothing factor with their associated posterior probability (p(xdet | H1)) for H1, in %. When the frequency is detected several times within 4 μHz, only the highest posterior is shown. The long vertical black lines show the minimum minimorum and maximum maximorum frequencies.
Current usage metrics show cumulative count of Article Views (full-text article views including HTML views, PDF and ePub downloads, according to the available data) and Abstracts Views on Vision4Press platform.
Data correspond to usage on the plateform after 2015. The current usage metrics is available 48-96 hours after online publication and is updated daily on week days.
Initial download of the metrics may take a while.