Fig. 5
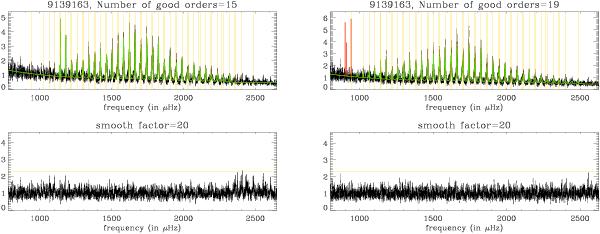
Detection of left-out modes. All power spectra are shown as a function of frequency smoothed over 20 bins. Before the refit: (top, left) power spectrum of KIC 9139163 with the fitted model with accepted modes (green) and with the guess frequencies provided by the fitters (orange lines). (Bottom, left) Power spectrum normalised to the fitted model; the orange horizontal line indicates the level at which the null hypothesis is rejected at the 1% level. After the refit: (top, right) power spectrum of KIC 9139163 with the fitted model for either accepted modes (green), rejected modes (red), or the guess frequencies provided a posteriori by the fitters (orange lines). (Bottom, right) Power spectrum normalised to the fitted model; the orange horizontal line indicates the level at which the null hypothesis is rejected at the 1% level.
Current usage metrics show cumulative count of Article Views (full-text article views including HTML views, PDF and ePub downloads, according to the available data) and Abstracts Views on Vision4Press platform.
Data correspond to usage on the plateform after 2015. The current usage metrics is available 48-96 hours after online publication and is updated daily on week days.
Initial download of the metrics may take a while.