Fig. 2
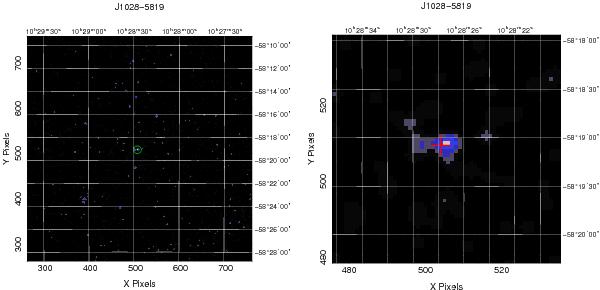
Left panel: Swift/XRT image (20′ × 20′) of the field of PSR J1028–5819 in the 0.3–10 keV energy range. The source highlighted by the green circle is the pulsar’s X-ray counterpart (Abdo et al. 2009a; Marelli et al. 2011). Right panel: zoom-in of the Swift/XRT image ( on the source position. The red cross marks the ATCA position of PSR J1028–5819 (Keith et al. 2008).
Current usage metrics show cumulative count of Article Views (full-text article views including HTML views, PDF and ePub downloads, according to the available data) and Abstracts Views on Vision4Press platform.
Data correspond to usage on the plateform after 2015. The current usage metrics is available 48-96 hours after online publication and is updated daily on week days.
Initial download of the metrics may take a while.