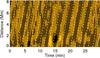
Fig. 5
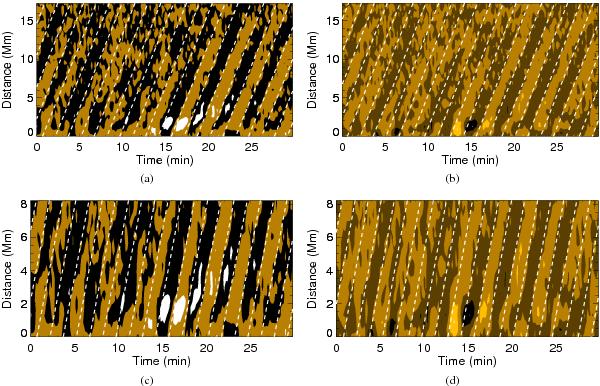
Application of BSM to R1 a), R2 c), D1 b), and D2 d). In each panel, the running difference of the time-distance plot is overlaid with the contour (white dashed line) of the model function Acos(ωt − kx + φ) with the fitted parameters. The fitted parameters are as follows: a) for R1, P = 180.0 ± 1.8 s, Vp = 47.0 ± 2.6 km s-1; c) for R2, P = 178.0 ± 2.0 s, Vp = 49.0 ± 4.5 km s-1; b) for D1, P = 180.0 ± 1.0 s, Vp = 47.0 ± 1.4 km s-1; d) for D2, P = 178.0 ± 1.0 s,Vp = 49.0 ± 2.8 km s-1.
Current usage metrics show cumulative count of Article Views (full-text article views including HTML views, PDF and ePub downloads, according to the available data) and Abstracts Views on Vision4Press platform.
Data correspond to usage on the plateform after 2015. The current usage metrics is available 48-96 hours after online publication and is updated daily on week days.
Initial download of the metrics may take a while.