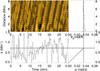
Fig. 3
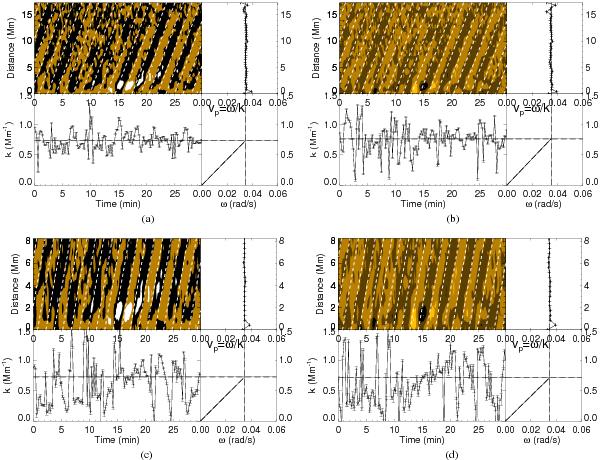
Application of CFT to R1a), R2c), D1b), and D2d). In each panel, top left: the running difference of the time-distance plot, overlaid with the contour (white dashed line) of the model function Acos(ωt − kx + φ) with the best-fitted parameters. Top right: the fitting result of ω as a function of the spatial location. The thick solid line is the weighted mean, the dashed lines indicate its uncertainties. Bottom left: the fitting result of k as a function of time. The thick solid line is the weighted mean, and the dashed lines indicate its uncertainties. Bottom right: the dispersion diagram and the calculation of phase speed Vp and its uncertainties. The fitted parameters are as follows: a) for R1, ω = 0.0347 ± 0.00002 rad/s, k = 0.738 ± 0.002 Mm-1, P = 181.2 ± 0.1 s, Vp = 47.0 ± 0.1 km s-1; c) for R2ω = 0.0350 ± 0.00003 rad/s, k = 0.727 ± 0.005 Mm-1, P = 179.7 ± 0.2 s,Vp = 48.1 ± 0.3 km s-1; b) for D1ω = 0.0349 ± 0.00003 rad/s, k = 0.762 ± 0.00 Mm-1, P = 180.0 ± 0.1 s, Vp = 45.8 ± 0.2 km s-1; d) for D2ω = 0.0349 ± 0.00003 rad/s, k = 0.716 ± 0.006 Mm-1, P = 180.0 ± 0.2 s,Vp = 48.6 ± 0.4 km s-1.
Current usage metrics show cumulative count of Article Views (full-text article views including HTML views, PDF and ePub downloads, according to the available data) and Abstracts Views on Vision4Press platform.
Data correspond to usage on the plateform after 2015. The current usage metrics is available 48-96 hours after online publication and is updated daily on week days.
Initial download of the metrics may take a while.