Fig. 1
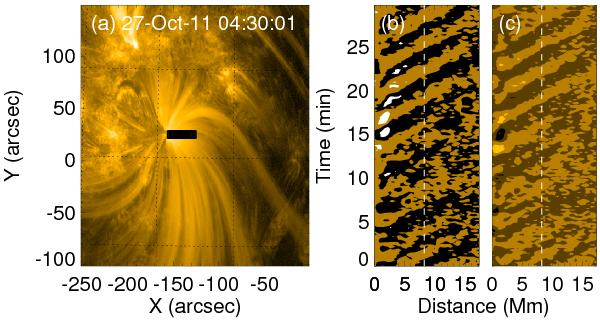
a) AIA 171 Å image of active region NOAA 11330 observed on 27 Oct. 2011 at 04:30:01 UT is shown with the flux on the logarithmic scale. A cut that was taken to make the time-distance plot is indicated with a black bar. b) The running difference R1 of the time-distance plot started at 04:30:01 UT. R2 is the first half of R1, to the left of the white dashed line. It covers about 10 cycles of the propagating features. Panel c) shows the background-subtracted time-distance plot D1. The first half of D1 on the left of the white dashed line is D2.
Current usage metrics show cumulative count of Article Views (full-text article views including HTML views, PDF and ePub downloads, according to the available data) and Abstracts Views on Vision4Press platform.
Data correspond to usage on the plateform after 2015. The current usage metrics is available 48-96 hours after online publication and is updated daily on week days.
Initial download of the metrics may take a while.