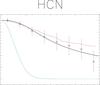
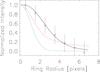
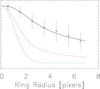
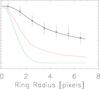
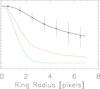
Fig. 7
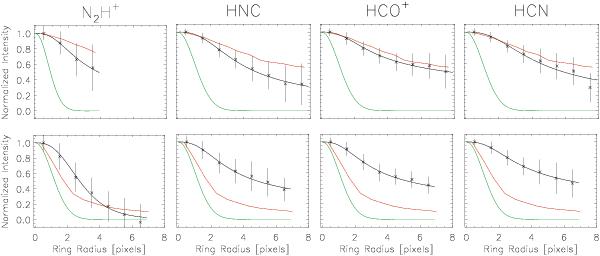
Examples of normalized radial profiles for sources BLAST063 (starless, top panels) and BLAST082 (proto-stellar, bottom panels). The points and error bars represent the ring-averaged integrated intensity in the molecular lines (from left to right) N2H+(1−0), HNC(1−0), HCO+(1−0) and HCN(1−0). The black solid line represents the fit obtained using Eq. (8). The red solid line shows the radial profile of the averaged BLAST intensity at 250 μm, and the green solid line represents the 3-mm beam profile of the Mopra telescope. Each pixel corresponds to 15 arcsec.
Current usage metrics show cumulative count of Article Views (full-text article views including HTML views, PDF and ePub downloads, according to the available data) and Abstracts Views on Vision4Press platform.
Data correspond to usage on the plateform after 2015. The current usage metrics is available 48-96 hours after online publication and is updated daily on week days.
Initial download of the metrics may take a while.