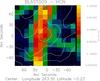
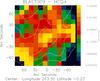
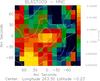
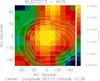
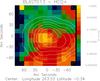
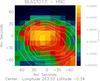
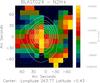
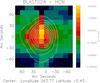
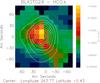
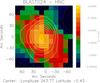
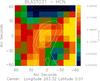
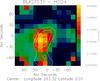
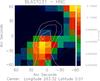
Fig. A.1
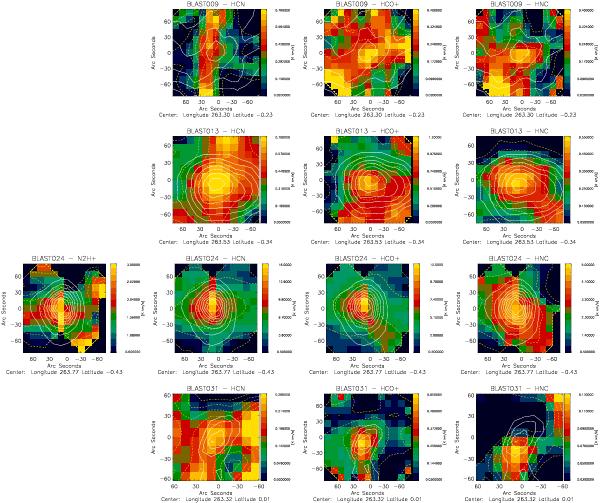
Maps of the line integrated intensities (from left to right, N2H + (1 − 0), HCN(1 − 0), HCO + (1 − 0) and HNC(1 − 0), in units of  [K km s-1] ) of selected sources toward Vela-D. In this figure we show, from top to bottom, maps of BLAST009, BLAST013, BLAST024 and BLAST031. The white dashed contours represent the BLAST flux density at 250 μm.
Current usage metrics show cumulative count of Article Views (full-text article views including HTML views, PDF and ePub downloads, according to the available data) and Abstracts Views on Vision4Press platform.
Data correspond to usage on the plateform after 2015. The current usage metrics is available 48-96 hours after online publication and is updated daily on week days.
Initial download of the metrics may take a while.