Fig. 11
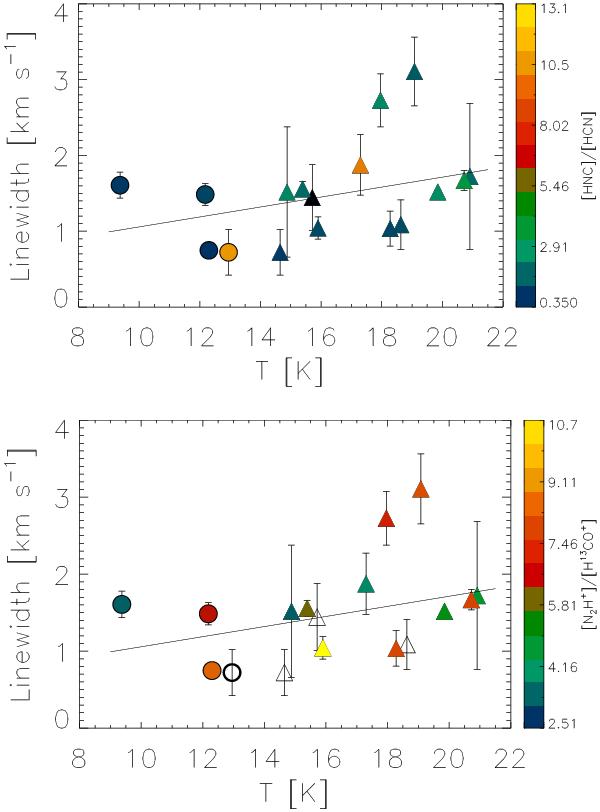
Plot of average linewidth vs. core temperature. The BLAST-derived dust temperature has been used, except in those sources where Tk could be determined from NH3 (see Sect. 3.3). In estimating the averages, only the linewidths of the optically thin molecular tracers (N2H+, H13CO+ and H13CN) have been considered. As in Figs. 1 and 5 starless cores are represented by circles, but proto-stellar cores are shown by triangles (instead of crosses, for best use of the color code). The filling color code represents the relative abundance [HNC]/[HCN] (top panel) and [N2H+]/[H13CO+] (bottom panel). The solid line represents the linear fit (from Bayesian statistics) to all points.
Current usage metrics show cumulative count of Article Views (full-text article views including HTML views, PDF and ePub downloads, according to the available data) and Abstracts Views on Vision4Press platform.
Data correspond to usage on the plateform after 2015. The current usage metrics is available 48-96 hours after online publication and is updated daily on week days.
Initial download of the metrics may take a while.