Fig. 6
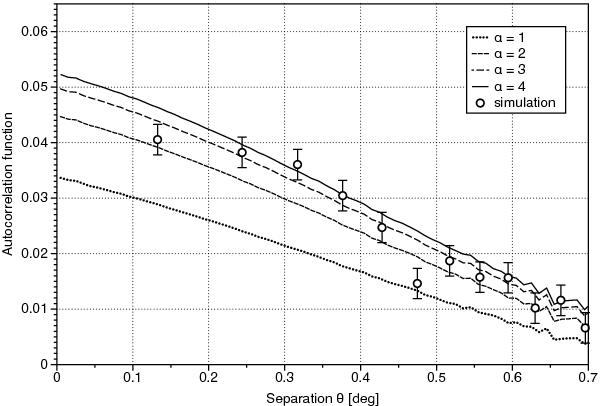
Comparison of the sample correlation coefficients (circles) of the parallax errors of source pairs in Case A with the average theoretical coefficients (lines) computed for ω = 1.16 in successive approximations (α). The pairs were grouped in samples of equal size depending on θ, and the sample correlation coefficient plotted against the average θ of each group. To reduce the statistical uncertainty of the sample correlation coefficients (indicated by the error bars), many more pairs were used to compute the sample values than the 150 000 pairs for which theoretical values were available.
Current usage metrics show cumulative count of Article Views (full-text article views including HTML views, PDF and ePub downloads, according to the available data) and Abstracts Views on Vision4Press platform.
Data correspond to usage on the plateform after 2015. The current usage metrics is available 48-96 hours after online publication and is updated daily on week days.
Initial download of the metrics may take a while.