Fig. 5
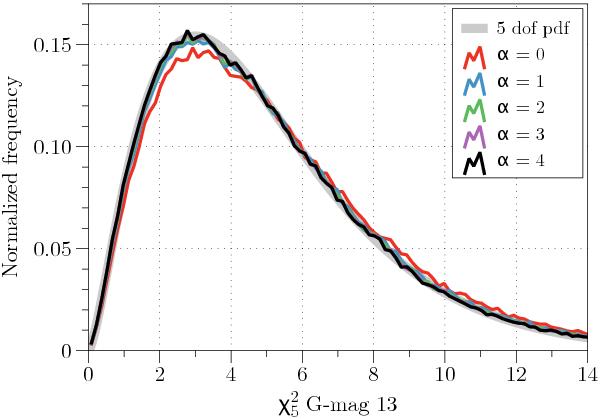
Distribution of the chi-square values included in the calculation of S5,n for the single sources in Case A. The thick grey curve is the expected chi-square distribution with 5 degrees of freedom; the coloured curves give the experimental distribution for 300 000 sources using successively higher orders of approximation (α) for the estimated covariances. A fudge factor ω = 1.16 was assumed. For the highest order (α = 4) the experimental distribution is indistinguishable from the theoretical one.
Current usage metrics show cumulative count of Article Views (full-text article views including HTML views, PDF and ePub downloads, according to the available data) and Abstracts Views on Vision4Press platform.
Data correspond to usage on the plateform after 2015. The current usage metrics is available 48-96 hours after online publication and is updated daily on week days.
Initial download of the metrics may take a while.