Fig. 1
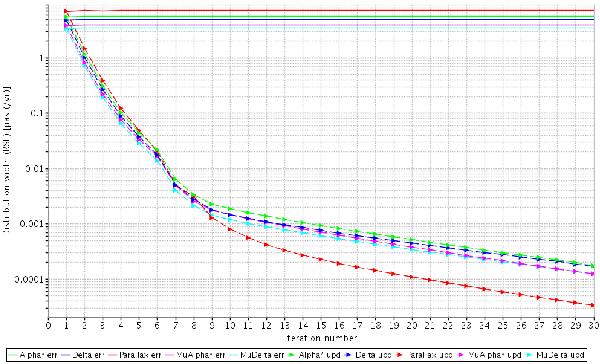
Convergence plot for the astrometric solution in Case A. The solid curves show the rms errors of the astrometric parameter (i.e., the rms differences between the calculated and true values) as functions of the iteration number; the dashed curves show the rms of the corresponding source parameter updates. The different astrometric parameters are colour coded (green: α∗, blue: δ, red: ϖ, magenta: μα∗, cyan: μδ).
Current usage metrics show cumulative count of Article Views (full-text article views including HTML views, PDF and ePub downloads, according to the available data) and Abstracts Views on Vision4Press platform.
Data correspond to usage on the plateform after 2015. The current usage metrics is available 48-96 hours after online publication and is updated daily on week days.
Initial download of the metrics may take a while.