| Issue |
A&A
Volume 543, July 2012
|
|
|---|---|---|
| Article Number | A69 | |
| Number of page(s) | 9 | |
| Section | Atomic, molecular, and nuclear data | |
| DOI | https://doi.org/10.1051/0004-6361/201118766 | |
| Published online | 28 June 2012 | |
High-resolution study of oscillator strengths and predissociation rates for 12C16O
W-X bands and Rydberg complexes between 92.9 and 93.4 nm
1 Observatoire de Paris, 5 place Jules Janssen, 92195 Meudon, France
e-mail: This email address is being protected from spambots. You need JavaScript enabled to view it.
; This email address is being protected from spambots. You need JavaScript enabled to view it.
; This email address is being protected from spambots. You need JavaScript enabled to view it.
;
2 LAMAp/LERMA, Université de Cergy-Pontoise, 95031 Cergy-Pontoise, France
e-mail: This email address is being protected from spambots. You need JavaScript enabled to view it.
; This email address is being protected from spambots. You need JavaScript enabled to view it.
3 Department of Physics and Astronomy, University of Toledo, Toledo, OH, USA
e-mail: This email address is being protected from spambots. You need JavaScript enabled to view it.
; This email address is being protected from spambots. You need JavaScript enabled to view it.
4 Department of Physics, Wellesley College, Wellesley, MA, USA
e-mail: This email address is being protected from spambots. You need JavaScript enabled to view it.
;This email address is being protected from spambots. You need JavaScript enabled to view it.
5 LPMAA, Université UPMC, Paris 06 and CNRS, UMR 7092, 75006 Paris, France
e-mail: This email address is being protected from spambots. You need JavaScript enabled to view it.
6 Department of Earth and Space Sciences, UCLA, Los Angeles, CA, USA
e-mail: This email address is being protected from spambots. You need JavaScript enabled to view it.
7 93 Pleasant Street, Watertown, MA 02472, USA
e-mail: This email address is being protected from spambots. You need JavaScript enabled to view it.
8 DESIRS beam line, Synchrotron SOLEIL, Saint Aubin, France
e-mail: This email address is being protected from spambots. You need JavaScript enabled to view it.
Received: 31 December 2011
Accepted: 13 February 2012
Abstract
Models of astronomical environments containing CO require accurate molecular data to reproduce and interpret observations. We are conducting experiments at the SOLEIL synchrotron facility to acquire data for modeling CO photochemistry in the vacuum ultraviolet. The improvement in UV spectroscopic instrumentation, both in sensitivity and resolution, provides more accurate laboratory spectroscopic determinations. We report new measurements yielding photoabsorption oscillator strengths and predissociation rates, for 12C16O at 295 K and 77 K, of four bands from X 1Σ+ (v′′ = 0) to the v′ = 0–3 vibrational levels of the core-excited W 1Π Rydberg state and for six overlapping bands between 92.97 and 93.35 nm. Absorption spectra were recorded using the vacuum ultraviolet Fourier transform spectrometer installed on the DESIRS beamline at SOLEIL, providing a resolving power R = 350 000. This resolution allows the analysis of individual line strengths and widths in the electronic transitions and the identification of a previously unobserved perturbation in the W(1) level. Gas column densities in the differentially-pumped system were calibrated using the B 1Σ+ – X 1Σ+(0, 0) band. Absorption bands are analyzed by synthesizing line and band profiles with independently developed codes. These considerably improved results are compared with earlier determinations.
Key words: techniques: spectroscopic / ISM: molecules / methods: laboratory / molecular data / ultraviolet: ISM
© ESO, 2012
1. Introduction
Owing to its abundance, CO is used as a probe of many astronomical environments including photon-dominated regions in interstellar clouds, circumstellar disks around newly formed stars, and the envelopes surrounding stars near the end of their lives. In these environments, the carbon monoxide abundance and the ratio of its isotopologues are determined by its photochemistry, namely CO photodissociation under ultraviolet irradiation. The concentration of CO is determined by its interaction with the stellar UV field. Rydberg transitions play a key role in CO photodissociation and self-shielding (Letzelter et al. 1987; van Dishoeck & Black 1988; Visser et al. 2009). This latter process is particularly important, because the lines leading to dissociation of abundant isotopologues become optically thick, limiting the overall CO destruction. Self-shielding has been seen in diffuse molecular clouds (e.g., Federman et al. 2003; Sheffer et al. 2007) and in circumstellar disks surrounding newly formed stars (Smith et al. 2009), and it is thought to explain the oxygen isotopic abundances measured in meteorites (e.g., Clayton 2002; Yurimoto & Kuramoto 2004; Lyons & Young 2005; Young 2007). The degree of self-shielding is controlled by the oscillator strengths and positions of dissociating bands and by the widths of lines when dominated by predissociation.
The photoabsorption spectrum of CO between the molecule’s lowest dissociation limit (111.8 nm) and the ionization limit of atomic hydrogen (91.2 nm) is characterized by a complex array of bands that display a wide range of strengths, line widths, and rotational contours. At the longest wavelengths, transitions to low-v vibrational levels of the first Rydberg states in the series converging to the CO+X  state are prominent. Shortward of 100 nm, the spectrum becomes progressively more congested and complex as additional excited electronic states are accessed. The strongest transitions in this region involve higher Rydberg states converging to the CO+ ground state and the CO+A 2Π state. There are striking variations in line widths from band to band, with some bands exhibiting highly diffuse structures and others appearing sharp at the highest spectral resolutions studied in the laboratory. Line strengths and line widths are strongly affected by isotopic substitution. Overviews and discussions of the spectroscopy of the 91.2 to 111.8 nm region are found in Huber (1997), Eidelsberg et al. (2004a), Lefebvre-Brion & Lewis (2007), Vásquez et al. (2009), and Lefebvre-Brion et al. (2010). Despite extensive experimental and theoretical efforts, considerable uncertainties and gaps remain in the spectroscopic database, including fundamental parameters such as oscillator strengths, line widths, and isotopic effects. Building on the first detailed survey of line positions, band oscillator strengths (f-values), and predissociation rates by Eidelsberg et al. (1991) and subsequent experimental reports, Visser et al. (2009) compiled a comprehensive set of transition parameters for a number of CO isotopologues.
The current investigation presents high-resolution measurements of f-values and upper-level predissociation rates for transitions to (a) the four lowest vibrational levels of the W 3sσ1Π state (built on the CO+A 2Π core) and; (b), two p complexes, 4p(2) and 5p(0), in the Rydberg series converging to the v = 2 and v = 0 levels of the CO+ ground state (Eidelsberg et al. 2004a). Collectively, these are among the strongest absorption features in the 91.2 to 100 nm region.
W band f-values and predissociation rates were first reported by Eidelsberg & Rostas (1990) and Eidelsberg et al. (1991) based on data collected with the 10 m spectrograph at Meudon, France, and with the ACO synchrotron (Anneau de Collision d’Orsay, France). Subsequent higher-resolution measurements were reported by Stark et al. (1991, 1993) and Yoshino et al. (1995) using the Photon Factory synchrotron in Tsukuba, Japan (the latter at a temperature of 20 K), by Hinnen et al. (1998) using a narrowband and tunable XUV-laser source, and by Eidelsberg et al. (2006) using the Super-ACO synchrotron in Orsay. Spectra of interstellar clouds acquired with the Far Ultraviolet Spectroscopic Explorer by Sheffer et al. (2003) were used to extract f-values for the W – X (1, 0), (2, 0), and (3, 0) bands (hereafter, W10, W20, W30) based on column density calibrations from CO A – X bands. Eidelsberg et al. (2006) also reported W – X f-values for the 13C16O and 13C18O isotopologues. A series of laser-based measurements of line widths (Levelt et al. 1992a,b; Eikema et al. 1994; Komatsu et al. 1995) were used to determine predissociation rates for the W(0) and W(2) levels, and Eidelsberg et al. (1991, 2006) reported line width and predissociation rates for all four W vibrational levels from their photoabsorption spectra.
The congested and blended absorption features in the 92.9 to 93.4 nm region were studied via multi-photon ionization by Eikema et al. (1994) and were spectroscopically analyzed by Eikema et al. and by Eidelsberg et al. (2004a). Eidelsberg et al. found that the de-perturbed structures emerging from a least-squares fitting to the profiles are unambiguously two Rydberg p complexes, 4p(2) and 5p(0). In addition, these complexes are crossed by two non-Rydberg 1Π levels. The summed strengths of these blended features were measured by Eidelsberg et al. (1990) and by Stark et al. (1991). Line width measurements in this region are somewhat fragmentary, the most detailed being reported by Eikema et al. (1993) and Ubachs et al. (1994).
Here we extend this body of work through measurements at the third-generation SOLEIL synchrotron facility in Saint Aubin, France. The vacuum ultraviolet Fourier transform spectrometer (VUV-FTS) installed on the DESIRS beam line DESIRS beamline1, combining high spectral resolution and high signal-to-noise has allowed us to improve upon our earlier results for the W – X bands and the 4p and 5p complexes of 12C16O. This first report is part of a larger effort to catalog, interpret, and model the photoabsorption spectra of the isotopologues 12C16O, 13C16O, 12C17O, 12C18O, and 13C18O throughout the 91 to 112 nm region.
2. Experimental setup
The VUV-FTS is a permanent end-station of the high-resolution absorption spectroscopy branch of the DESIRS beamline at Synchrotron SOLEIL. The beamline undulator provides a 7% bandwidth of coherent continuum background (~6 nm full width at half maximum (FWHM) Gaussian profile at 100 nm). After a gas-filter chamber (Mercier et al. 2000) removes the unwanted high harmonics emitted by the undulator source, the continuum light passes through a gas-sample chamber before entering the VUV-FTS. Four overlapping spectral windows were employed in the present measurements. Figure 1 displays a typical transmission spectrum for a single spectral window.
 |
Fig. 1 a) (top) 12C16O absorption bands at 295 K over the full undulator bandwidth centered at 94.5 nm. b) (Bottom) a detail showing the 4p(2) and 5p(0) Rydberg complexes. The difference between I0(λ) and IC(λ) is due to absorption by an underlying unidentified continuum feature (cf. 4.1.3). |
The gas-sample chamber includes three independent set-ups: a windowless gas cell that can be cooled with liquid nitrogen (used in the present study), a windowed gas cell, and a free molecular jet. High-purity 12C16O gas (Alphagaz, 99.997%) continuously flowed through the 10-cm long windowless absorption cell equipped with two 15-cm external capillaries. The cell body is enclosed in a concentric cylindrical vessel, which can be filled with liquid nitrogen to cool the flowing gas sample. Two stages of differential pumping maintain the ultrahigh vacuum in the VUV-FTS and in the DESIRS beamline. The absorption cell pressure cannot be directly measured, nor is that pressure constant with position in the cell and capillaries. A 0.1 mbar full-scale capacitance gauge monitored the CO pressure in the external gas-handling system. Small drifts in this pressure (~5%) were electronically recorded during absorption scans. The CO column densities in the windowless cell were determined for each external pressure setting by recording a series of absorption profiles of the B(0) – X(0) band at 112 nm. The B00 band f-value has been well-characterized via laser-based and synchrotron-based absorption measurements in a windowed cell (Stark et al. 1999; Federman et al. 2001, respectively). Column densities in the windowless cell ranged from 3.2 to 16 × 1014 cm-2.
The VUV-FTS is described in detail in de Oliveira et al. (2009, 2011). It is a wave-front division interferometer and relies on a modified Fresnel bi-mirror configuration requiring only flat mirrors. The path difference is scanned through the translation of one reflector. This translation is measured by means of an external frequency-stabilized He-Ne laser, providing a very sensitive interferometric determination of the optical path difference variation. In the vertical polarization mode of the undulator, the VUV-FTS covers the 6.4 to 30 eV (195 to 40 nm) spectral range (conventional amplitude-division-based FTS are limited to λ > ~ 140 nm (Thorne 1998) due to material limitations). A post-recording computation performs a standard FTS phase correction and corrects for residual sampling errors (less than one single interval in general). Owing to strict linearity in the wavenumber scale, the spectra can be put on an absolute scale using a single reference wavelength in the source. While the maximum resolution of the VUV-FTS is ~0.16 cm-1, signal-to-noise (S/N) considerations dictated a resolution of 0.32 cm-1 for most scans. Over the course of about 1 hour of data collection, 100 co-added scans typically resulted in an S/N ratio at the peak of the undulator bandpass of ~60.
In summary, the VUV-FTS provides a typical measured resolving power of ~350 000 in the 90 to 125 nm range, considerably higher than conventional broadband techniques based on grating spectrometers. Furthermore, the instrument provides an efficient data collection rate (de Oliveira et al. 2011), which is particularly important during a synchrotron run because the time given to perform measurements is limited. The quality of the CO absorption spectra obtained with this instrument shows significant improvement over those previously obtained at the Super-ACO synchrotron ring in Orsay (Eidelsberg et al. 2004b, 2006) and at the Photon Factory facility in Japan (e.g., Stark et al. 1991, 1993).
3. Data analysis
Spectra were obtained at several CO pressures between approximately 10 and 50 μbar (recorded upstream from the windowless cell) in four overlapping wavelength regions. Measurements were made at room temperature, 295 K, and with the absorption cell cooled by liquid nitrogen; the latter measurements were used to disentangle the strongly blended bands at the shortest wavelengths considered here. At each recorded pressure, a calibration band of well-known oscillator strength was measured to determine the gas column density. The rotationally resolved B – X (0, 0) band at 115 nm, with an f-value of 6.5 × 10⁻³, was adopted from the works of Stark et al. (1999) and Federman et al. (2001) for this purpose.
The fitting procedure used to determine the oscillator strengths of the CO absorption bands has been described previously (Eidelsberg et al. 1999, 2004b); here we provide a brief summary. From the record of the transmitted intensity I(λ) we first derive the incident flux of the undulator source, I0(λ). This was approximated as a Gaussian-shaped curve and was considered to be linear over small wavelength regions, as shown in Figs. 1a and b. For an ideal measurement with infinite resolving power, I(λ) and I0(λ) may be transformed into an optical depth, τ(λ), using the Beer Lambert law, ![Mathematical equation: \begin{equation} \label{equ} \tau (\lambda ) = \ln[I_{0}(\lambda )/I(\lambda )]. \end{equation}](/articles/aa/full_html/2012/07/aa18766-11/aa18766-11-eq37.png) (1)The absorption cross section, σ(λ), and band-integrated oscillator strength, fij, are related to the optical depth and gas column density, N, according to σ(λ) = τ(λ)/N, and
(1)The absorption cross section, σ(λ), and band-integrated oscillator strength, fij, are related to the optical depth and gas column density, N, according to σ(λ) = τ(λ)/N, and  (2)where λ is in nm, N is in cm-2, and σ is in cm2, and the integration is over the band profile. For our measurements the level i always refers to the X
  v′′ = 0 ground state level.
Oscillator strengths may not be directly calculated from the observed transmission spectrum when the instrumental resolution is comparable to, or greater than, the line-widths of the observed absorption features. This is certainly the case here and the effects of instrument broadening have been treated explicitly. For each band of interest, a simulated absorption cross section, σ(λ), is first calculated from the position, strength, and predissociation line-width of each constituent rotational line. Then, Doppler-broadened line-shapes are constructed for each line and their sum is used to generate an optical depth and ideal absorption spectrum, I(λ). A model transmission spectrum is obtained by convolving I(λ) with a sinc function instrumental broadening profile, matching the theoretical profile of the Fourier-transform spectrometer. The transmission profile constructed in this way reproduces in detail the oscillations seen in narrow atomic Ar absorption features used for wavelength calibration. The FWHM of the instrumental sinc function is 4.2 × 10⁻⁴ nm at 115 nm and 2.8 × 10⁻⁴ nm at 93.1 nm.
 |
Fig. 2 12C16O B – X (0–0) calibration band. Experimental spectrum (black dots) and fit (blue line). The fitting residuals (exp. – fit) are displaced downward for clarity. |
The line positions of rotational lines comprising the modeled bands were either fixed to previously measured values or slight adjustments were made based on the SOLEIL spectra, and their predissociation line widths and strengths were adjusted either by iterative fitting or by a non-linear least-squares fitting procedure to best match the measured spectra. For some bands a single oscillator strength is specified and the strengths of the individual rotational transitions are governed by Hönl-London line strength factors and a temperature-dependent Boltzmann distribution of ground-state rotational levels. For the remaining cases, in which deviations from the unperturbed line strength patterns are clearly evident, a non-Hönl-London J-dependence and variation between rotational branches was permitted. A deperturbation model was assumed for fitting the bands between 92.9 and 93.4 nm (the 4p and 5p complexes). When appropriate, a Lorentzian line width component corresponding to the predissociation lifetime of the upper state was introduced with a J(J+1) dependence.
As a test of the model fitting procedure, the B − X (0, 0) band was independently analyzed using a least-squares fitting procedure used in a previous study of B − X (0, 0) absolute f-values, and for analyses of N2 spectra (e.g., Stark et al. 2005). This method fits line positions, strengths, and widths to each rotational transition independently and without the assumption of any vibrational-band molecular parameters. In this way, a more precise fit of the observed spectrum is obtained but the analysis of highly blended regions is more difficult or not feasible. The two analysis methods used here yielded column densities from the B − X (0, 0) absorption band with agreement to better than 3%. A fit of B − X (0, 0) using the band model method is shown in Fig. 2.
4. Results and discussion
4.1. W bands
The four 3sσ1Π (v′ = 0, 1, 2, 3) – X (v′′ = 0) bands labeled W00, W10, W20, and W30 in Fig. 1a were previously studied at lower resolution by Eidelsberg et al. (2006). Their f-values and predissociation lifetimes are re-investigated here and the present measurements and model fits are shown in Fig. 3. A comparable spectrum of Eidelsberg et al. (2006) is also shown for W20, demonstrating the order-of-magnitude improvement in resolution achieved by the present experimental setup. The measured wavelengths for the rotationally resolved lines of W00 and W20 agree well with the values published by Eikema et al. (1994) obtained with laser-based measurements at a resolution of 0.32 cm-1 (0.29 × 10⁻³ nm) at 95 nm. A previously unobserved perturbation in the W(1) level has been analyzed, resulting in new line assignments for the W10 band (see below).
4.1.1. W – X (0, 0)
Figure 3 shows the W00 band, for which the P- and Q-branch lines are well-resolved and very narrow. Band oscillator strengths derived from fitting individual Q-branch lines were found to decrease slightly for J > 11, whereas band f-values derived from P- and R-branch lines show no such variation. A band f-value determined by fitting the entire band using Hönl-London factors for a 1Π − 1Σ transition is 3% higher than the value extracted from fitting individual Q-branch lines with J < 12. The Q-branch rotational line widths are approximately independent of J, while P-branch line widths show a quite rapid increase with increasing rotation (see Table 2).
4.1.2. W – X (1, 0)
A simulated spectrum of the W10 band is compared with the experimental data in Fig. 3. This band is heavily predissociated with lines for J′′ < 6 blended in all rotational branches. The high quality of the present spectra has enabled the analysis of the blended bandhead region and has led to a reassignment of Q-branch lines. The rotational numbering for all Q-branch lines with J′′ > 5 has been increased by one relative to the previous assignments of Eidelsberg et al. (2006). A satisfactory fit of the entire W10 band has been achieved by assuming that each triplet of P(J′+1), Q(J′), and R(J′ − 1) lines has a common upper-level term value and predissociation rate, and that any deviations from Hönl-London line strengths are common within each triplet. That is, the model assumes common values of these parameters for the e- and f-parity levels of W(1). There is then an apparent perturbation of W(1) with an unknown state, as evidenced by a ~4 cm-1 deflection of W(1) energy levels around a level crossing between J = 5 and 6. Accompanying this level crossing is a local decrease in predissociation broadening and oscillator strength, although the precise trends are only poorly constrained because of the highly blended nature of the bandhead region. The revised term values for the rotational levels of the W(1) state are listed in Table 4. They are derived from lines calibrated with an uncertainty of ~0.05 cm-1 obtained with the VUV-FTS.
4.1.3. W – X (2, 0) and (3, 0)
The syntheses of the W20 and W30 bands were relatively straightforward because rotational line strengths were well-characterized by Hönl-London factors. In both bands, predissociation line widths were found to be J-dependent and distinct for e- and f-parity levels. A small perturbation in the energy of the W(2) J = 8 e-parity level was deduced by Eikema et al. (1994) and is also observed here. The observed and synthetic spectra of W20 and W30 appear in Fig. 3.
 |
Fig. 3 12C16O W(v′ = 0, 1, 2, 3) – X(0) bands. Experimental spectrum (black dots) and fit (blue line). Fit of the Super-ACO spectrum (red line) for the (2–0) band. Note the variation in wavelength and vertical scales between panels. |
4.1.4. Summary
The deduced f-values for the four W bands are reported in Table 1 along with results from previous measurements, showing good agreement. The accuracy of the present measurements is limited primarily by the 6% uncertainty of the calibrating B00 f-value. The consistency among measurements with quite dissimilar instrumental resolution occurs for the most part because the upper levels studied have high predissociation rates. This leads to relatively broad rotational line profiles and minimal systematic errors associated with the under-resolution of line profiles.
12C16O oscillator strengths for the W(v = 0, 1, 2, 3) – X (0) bands.
The measured natural line widths, ΓL, of rotational transitions in the W bands range broadly, from 0.04 to 3.7 cm-1FWHM (4 × 10⁻⁵ to 3.2 × 10⁻⁴ nm). Predissociation rates (k) are related to the line widths via k(s-1) = 2πΓL(s-1), or (Eidelsberg et al. 2006) ![Mathematical equation: \begin{equation} \label{equ2} k({\rm s}^{-1})=\left(1.885\times10^{-10}\right) ~\Gamma_{\rm L} ({\rm m{\AA}}) \left[\frac{1000}{\lambda({\AA})}\right]^2\cdot \end{equation}](/articles/aa/full_html/2012/07/aa18766-11/aa18766-11-eq70.png) (3)Formally, k is the total decay rate and includes both predissociative and radiative decay, but in the present measurements any line widths broad enough to be observable must be dominated by the effect of predissociation. The present predissociation rates and their J-dependences are listed in Table 2 along with previously reported results. We find a J dependence in the predissociation rates for all e- and f-parity levels of the four observed excited states. The newly deduced predissociation rates are generally consistent with the earlier synchrotron-based measurements of Eidelsberg et al. (1991, 2006), but are now supplemented with determinations of J-dependences. All other references in Table 2 are to laser absorption and ionization experiments investigating the predissociation of W(v = 0) and W(v = 2). The consistency of the f-values and predissociation rates in the literature, and the newly determined J-dependencies in line strengths and line widths, provide a secure basis for incorporation into photochemical models.
(3)Formally, k is the total decay rate and includes both predissociative and radiative decay, but in the present measurements any line widths broad enough to be observable must be dominated by the effect of predissociation. The present predissociation rates and their J-dependences are listed in Table 2 along with previously reported results. We find a J dependence in the predissociation rates for all e- and f-parity levels of the four observed excited states. The newly deduced predissociation rates are generally consistent with the earlier synchrotron-based measurements of Eidelsberg et al. (1991, 2006), but are now supplemented with determinations of J-dependences. All other references in Table 2 are to laser absorption and ionization experiments investigating the predissociation of W(v = 0) and W(v = 2). The consistency of the f-values and predissociation rates in the literature, and the newly determined J-dependencies in line strengths and line widths, provide a secure basis for incorporation into photochemical models.
4.2. The 92.97–93.37 nm region (4p(2) and 5p(0) complexes)
Absorption spectra from 92.97 to 93.37 nm, obtained at liquid nitrogen and room temperatures, are shown in Figs. 4a and b, respectively, and are compared with model fits. A synthetic spectrum showing detailed assignments for five bands terminating on two Rydberg p complexes, 4p(2) and 5p(0), and a non-Rydberg 1Π level (II 1Π), is presented in Fig. 5. The diffuse profile of a second non-Rydberg level (I 1Π), deduced from the residuals in the fitted spectra, is also indicated in Fig. 5. The room temperature band profiles are strongly blended, with the exception of the well-resolved 4pπ(2) – X(0) band. In the analysis below we primarily report measurements of f-values and predissociation rates that complement the spectroscopic analysis of Eidelsberg et al. (2004a).
12C16O predissociation rates for the W(v = 0, 1, 2, 3) – X (0) bands.
4.2.1. 4p(2) complex
Fits to the 4pπ1Π(2) – X(0) spectrum were initially made using Hönl-London line strength factors appropriate for a pure 1Π − 1Σ transition. After comparison with the measured spectrum, a small discrepancy between the R- and P-branch intensities was identified that reflects the l-uncoupling interaction that mixes the 4pπ(2) and 4pσ(2) states. Small J-dependent corrections for the relative intensities of the R and P lines were then introduced for lines with J > 10 to improve the overall fit of the band. Approximately equivalent J-dependent line broadening is observed in the e- and f-parity levels of the 4pπ(2) state.
A band with very sharp rotational lines (band origin ~91.14 nm) was observed by Eikema et al. (1994) and its upper state was attributed by Eidelsberg et al. (2004a) to the 4pσ1Σ(2) member of the 4p(v = 2) Rydberg complex. The vibrational wavefunction of 4pσ(2) does not overlap with v′′ = 0 of the ground state to any significant extent; the band gains strength through the interaction of the rotational levels of 4pσ(2) with the e-parity levels of the nearby II 1Π state at 93.101 nm. The resultant crossing near J = 7 leads to a convergence of the 4pσ1Σ(2) − X(0) R branch near 93.114 nm. Simulations of the 4pσ1Σ(2) – X(0) band were generated using the published line positions and line widths of Eikema et al. (1994) and line strengths that follow a Hönl-London distribution for a 1Σ − 1Σ transition. The best-fit integrated oscillator strength for this band was extracted following comparison of the simulated spectrum and the measured absorption spectrum.
12C16O f-values and predissociation rates for the five resolved bands, the diffuse I 1Π band and a deduced continuum feature.
4.2.2. 5p(0) complex
Four bands are modeled simultaneously with an excited-state interaction model involving the 5pπ1Π(0) and 5pσ(0) Rydberg levels and two non-Rydberg states, I 1Π and II 1Π. The lowest energy state, I 1Π, is a diffuse band and has been characterized by Eidelsberg et al. (2004a) in high-pressure jet absorption spectra that allowed for the detection of highly-broadened R and P lines in the long-wavelength wing. The I 1Π – X(0) band is completely overlapped by the 5pσ(0) – X(0) band in our 295 K and 77 K spectra. The II 1Π – X(0) and 5pπ1Π(0) – X(0) bands consist of broad lines partially resolved in room temperature spectra. The red-degraded R branch of the 5pπ1Π(0) – X(0) band indicates that its Rydberg upper state interacts extensively with the valence I 1Π state.
The band spectra were simulated taking into account the interactions between the four excited states 5pπ1Π(0), 5pσ(0), I 1Π, and II 1Π. De-perturbed molecular parameters and interaction energies were calculated by Eidelsberg et al. (2004a) from a diagonalization of the energy level matrix, and mixing coefficients of the perturbed levels were obtained for each value of J. The perturbed intensities for rotational transitions to the 5p(0) complex and the I and II 1Π states were calculated as described by Lefebvre-Brion & Field (2004). For this, it was necessary to assign a de-perturbed oscillator strength to each state that best reproduces the perturbed spectrum.
The P(1) line of the 5pσ(0) – X(0) band corresponds to the only excited level that does not mix with the 1Π states, and is then of pure Σ + electronic character. A fit of the P(1) line provided a direct measure of the 5pσ(0) line widths and a first approximation to the oscillator strength of the observed band. The P(1) line is found to be sharp and the observed widths of the R(J) and corresponding P(J + 2) lines increase as far as J = 10, and adopt a lower constant value for J > 10. This trend apparently results from a switch, with increasing J, in the dominant interaction partner of 5pσ(0) from I 1Π to 5pπ1Π(0).
A final best-fit simulation of the entire complex was obtained after varying the various oscillator strengths and line widths, and their J-dependences, for the 5pσ(0) – X(0), 5pπ1Π(0) – X(0), and II 1Π – X(0) bands.
Subtracting simulated spectra at room- and liquid nitrogen temperatures from the measured spectra allowed an estimation of the oscillator strength of the overlapped I 1Π – X(0) band. A calculated spectrum at 77 K is shown in Fig. 5 with the rotational branches of each band labeled.
4.2.3. Continuum
It was found necessary to introduce extra absorption into the model to reproduce the observed spectrum. This is represented by a continuum feature labeled IC(λ) in Fig. 1b and Cont. in Fig. 5. The integrated absorption cross section and an f-value for this feature were determined from the difference between the model and experimental spectra. The partitioning of oscillator strength between the diffuse 1Π band and the continuum feature in their small region of overlap is uncertain; the continuum profile was assumed to vary smoothly as shown in Fig. 5. The resulting continuum f-values obtained at three different pressures were found to agree well, which supports the identification. At the present time, the origin of this feature is not identified.
12C16O revised W(1) term values.
4.2.4. Final results
Measured and simulated spectra at 77 K and 295 K of all six bands between 92.97 and 93.37 nm are shown in Figs. 4a and 4b. The difference between measured and fitted spectra at 295 K is also plotted (Fig. 4b) and shows an average discrepancy at the 5% level.
The deduced f-values and predissociation rates are listed in Table 3 for the six identified bands and the unidentified continuum feature, and comparisons are made with previous results where available. Our result for the f-value of the isolated 4pπ1Π(2) – X(0) band agrees well with earlier measurements (Eidelsberg et al. 1991; Stark et al. 1991; Yoshino et al. 1995). The other bands were not individually resolved in earlier measurements and their f-values have been reported as summations over various wavelength ranges. Comparing these with similar summations of the present fully resolved f-values shows good agreement.
Previous measurements of predissociation rates between 92.97 and 93.37 nm are quite limited. Ours are the first reported rates for the 4pπ(2) and II 1Π levels. Our results for the 5pπ(0) level agree well with the laser-based measurements of Eikema et al. (1994) and Ubachs et al. (1994), who presented values without distinguishing between e and f parity levels. The present estimated predissociation rate for the 4pσ(2) level (0.3 × 10¹¹ s-1) is also consistent with their previously reported upper limit of 3.0 × 10¹⁰ s-1. However, a significant difference is found for the 5pσ(0) J = 0 level. Photochemical modeling efforts will benefit from the f-values for individual bands and the continuum in this wavelength region and from the refined set of predissociation rates presented here.
5. Concluding remarks
We presented oscillator strengths and predissociation rates for several Rydberg and valence transitions of 12C16O and for an underlying continuum feature observed in the 93.1–93.4 nm region. These were obtained from photoabsorption spectra recorded with the VUV-FTS on the DESIRS beamline of the SOLEIL synchrotron. Analyses of transitions to the v = 0–3 levels of the W 3sσ1Π state, the  and 1Π members of the 4p(2) and 5p(0) Rydberg p-complexes, and their 1Π perturbing valence states were presented. These improve on earlier synchrotron-based experiments by virtue of greater resolving power and signal-to-noise ratio. Many of the deduced f-values and predissociation rates show J-dependences that could not be extracted from the earlier datasets.
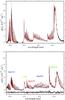 |
Fig. 4 a) (Top) measured absorption spectrum of the 4p(2) and 5p(0) Rydberg complexes recorded at 77 K (black line), and a modeled spectrum (red line). b) (Bottom) experimental and modeled absorption spectrum at 295 K with the fitting residuals also shown shifted by –0.70. |
 |
Fig. 5 Model absorption cross sections with rotational assignments of the 4p(2) and 5p(0) Rydberg complexes and 1Π valence states at a temperature of 77 K. The underlying continuum feature is also shown (see text). |
The refined spectroscopic parameters presented here will be of value to the development of photochemical models of CO. Similar future studies are planned for other CO isotopologues. We will then turn our attention to bands in the vicinity of 91.5 nm, where additional blended complexes are found. A detailed knowledge of predissociation rates and absorption f-values for all CO isotopologues is required to correctly model CO self-shielding in photochemical models, and will also improve our understanding of the structure of this important molecule through evidence of anomalies in its line strengths and widths.
Acknowledgments
M.E. and A.H. wish to thank H. Lefebvre-Brion for stimulating discussions and helpful suggestions. This research was supported by funds from CNRS (France), Programme National Physico-Chimie du Milieu Interstellaire (PCMI) and NASA (grants NNG 06-GG70G and NNX10AD80G to the Univ. of Toledo and NNX09AC5GG to Wellesley College). L.G. is granted by the European Community’s Seventh Framework Programme (FP7/2007-2013) Marie Curie ITN under grant agreement # 238258.
References
- Clayton, R. N. 2002, Nature, 415, 860 [NASA ADS] [CrossRef] [Google Scholar]
- de Oliveira, N., Joyeux, D., Phalippou, D., et al. 2009, RScI, 8, 3101 [Google Scholar]
- de Oliveira, N., Roudjane, M., Joyeux, D., et al. 2011, Nat. Photon., 5, 149 [NASA ADS] [CrossRef] [Google Scholar]
- Drabbels, M., Heinze, J., Ter Meulen, J. J., & Meerts, W. 1993, J. Chem. Phys., 99, 5701 [NASA ADS] [CrossRef] [Google Scholar]
- Eidelsberg, M., & Rostas, F. 1990, A&A, 235, 472 [NASA ADS] [Google Scholar]
- Eidelsberg, M., Benayoun, J. J., Viala, Y. P., & Rostas, F. 1991, A&AS, 90, 231 [NASA ADS] [CrossRef] [Google Scholar]
- Eidelsberg, M., Jolly, A., Lemaire, J. L., et al. 1999, A&A, 346, 705 [NASA ADS] [Google Scholar]
- Eidelsberg, M., Launay, F., Ito, K., et al. 2004a, J. Chem. Phys., 121, 292 [NASA ADS] [CrossRef] [Google Scholar]
- Eidelsberg, M., Lemaire, J. L., Fillion, J. H., et al. 2004b, A&A, 424, 355 [NASA ADS] [CrossRef] [EDP Sciences] [Google Scholar]
- Eidelsberg, M., Sheffer, Y., Federman, S. R., et al. 2006, ApJ, 647, 1543 [NASA ADS] [CrossRef] [Google Scholar]
- Eikema, K. S. E., Hogervorst, W., & Ubachs, W. 1994, Chem. Phys., 181, 217 [NASA ADS] [CrossRef] [Google Scholar]
- Federman, S. R., Fritts, M., Cheng, S., et al. 2001, ApJS, 134, 133 [NASA ADS] [CrossRef] [Google Scholar]
- Federman, S. R., Lambert, D. L., Sheffer, Y., et al. 2003, ApJ, 591, 986 [NASA ADS] [CrossRef] [Google Scholar]
- Hinnen, P. C., Stolte, S., Hogervorst, W., & Ubachs, W. 1998, JOSA B, 15, 2620 [NASA ADS] [CrossRef] [Google Scholar]
- Huber, K. P. 1997, Phil. Trans. R. Soc. Lond. A, 355, 1527 [NASA ADS] [CrossRef] [Google Scholar]
- Komatsu, M., Ebata, T., Maeyama, T., & Mikami, N. 1995, J. Chem. Phys., 103, 2420 [Google Scholar]
- Lefebvre-Brion, H. R. W. 2004, Field, The Spectra and Dynamics of Diatomic Molecules (Elsevier) [Google Scholar]
- Lefebvre-Brion, H., & Lewis, B. R. 2007, Mol. Phys., 105, 1625 [NASA ADS] [CrossRef] [Google Scholar]
- Lefebvre-Brion, H., Liebermann, H. P., & Vázquez, G. J. 2010, J. Chem. Phys., 132, 024311 [NASA ADS] [CrossRef] [Google Scholar]
- Letzelter, C., Eidelsberg, M., Rostas, F., Breton, J., & Thieblemont, B. 1987, Chem. Phys., 114, 273 [NASA ADS] [CrossRef] [Google Scholar]
- Levelt, P. F., Ubachs, W., & Hogervorst, W. 1992a, J. Phys. II France, 2, 801 [CrossRef] [EDP Sciences] [Google Scholar]
- Levelt, P. F., Ubachs, W., & Hogervorst, W. 1992b, J. Chem. Phys., 97, 7160 [NASA ADS] [CrossRef] [Google Scholar]
- Lyons, J. R., & Young, E. D. 2005, Nature, 435, 317 [NASA ADS] [CrossRef] [PubMed] [Google Scholar]
- Mercier, B., Compin, M., Prevost, C., et al. 2000, JVST, 18, 2533 [NASA ADS] [Google Scholar]
- Sheffer, Y., Federman, S. R., & Andersson, B.-G. 2003, ApJ, 597, L29 [NASA ADS] [CrossRef] [Google Scholar]
- Sheffer, Y., Rogers, M., Federman, S. R., Lambert, D. L., & Gredel, R. 2007, ApJ, 667, 1002 [NASA ADS] [CrossRef] [Google Scholar]
- Smith, R. L., Pontoppidan, K. M., Young, E. D., Morris, M. R., & van Dishoeck, E. F. 2009, ApJ, 701, 163 [NASA ADS] [CrossRef] [Google Scholar]
- Stark, G., Yoshino, K., Smith, P. L., Ito, K., & Parkinson, W. H. 1991, ApJ, 369, 574 [NASA ADS] [CrossRef] [Google Scholar]
- Stark, G., Smith, P. L., Ito, K., & Yoshino, K. 1992, ApJ, 395, 705 [NASA ADS] [CrossRef] [Google Scholar]
- Stark, G., Yoshino, K., Smith, P. L., et al. 1993, ApJ, 410, 837 [NASA ADS] [CrossRef] [Google Scholar]
- Stark, G., Lewis, B. R., Gibson, S. T., & England, J. P. 1999, ApJ, 520, 732 [NASA ADS] [CrossRef] [Google Scholar]
- Stark, G., Huber, K. P., Yoshino, K., Smith, P. L., & Ito, K. 2005, J. Chem. Phys., 123, 4303 [Google Scholar]
- Thorne, A. P. 1998, J. Anal. At. Spectrom., 13, 407 [NASA ADS] [CrossRef] [Google Scholar]
- Ubachs, W., Eikema, K. S. E., Levelt, P. F., et al. 1994, ApJ, 427, L55 [NASA ADS] [CrossRef] [Google Scholar]
- van Dishoeck, E. F., & Black, J. H. 1988, ApJ, 334, 771 [NASA ADS] [CrossRef] [Google Scholar]
- Vázquez, G. J., Amero, J. M., Liebermann, H. P., & Lefebvre-Brion, H. 2009, JPCA, 113, 13395 [NASA ADS] [CrossRef] [Google Scholar]
- Visser, R., van Dishoeck, E. F., & Black, J. H. 2009, A&A, 503, 323 [NASA ADS] [CrossRef] [EDP Sciences] [Google Scholar]
- Yoshino, K., Stark, G., Esmond, J. R., et al. 1995, ApJ, 438, 1013 [NASA ADS] [CrossRef] [Google Scholar]
- Young, E. D., & Edward, D. 2007, E&PSL, 262, 468 [Google Scholar]
- Yurimoto, H., & Kuramoto, K. 2004, Science, 305, 1763 [NASA ADS] [CrossRef] [PubMed] [Google Scholar]
All Tables
12C16O f-values and predissociation rates for the five resolved bands, the diffuse I 1Π band and a deduced continuum feature.
All Figures
|
Fig. 1 a) (top) 12C16O absorption bands at 295 K over the full undulator bandwidth centered at 94.5 nm. b) (Bottom) a detail showing the 4p(2) and 5p(0) Rydberg complexes. The difference between I0(λ) and IC(λ) is due to absorption by an underlying unidentified continuum feature (cf. 4.1.3). |
| In the text | |
|
Fig. 2 12C16O B – X (0–0) calibration band. Experimental spectrum (black dots) and fit (blue line). The fitting residuals (exp. – fit) are displaced downward for clarity. |
| In the text | |
|
Fig. 3 12C16O W(v′ = 0, 1, 2, 3) – X(0) bands. Experimental spectrum (black dots) and fit (blue line). Fit of the Super-ACO spectrum (red line) for the (2–0) band. Note the variation in wavelength and vertical scales between panels. |
| In the text | |
|
Fig. 4 a) (Top) measured absorption spectrum of the 4p(2) and 5p(0) Rydberg complexes recorded at 77 K (black line), and a modeled spectrum (red line). b) (Bottom) experimental and modeled absorption spectrum at 295 K with the fitting residuals also shown shifted by –0.70. |
| In the text | |
|
Fig. 5 Model absorption cross sections with rotational assignments of the 4p(2) and 5p(0) Rydberg complexes and 1Π valence states at a temperature of 77 K. The underlying continuum feature is also shown (see text). |
| In the text | |
Current usage metrics show cumulative count of Article Views (full-text article views including HTML views, PDF and ePub downloads, according to the available data) and Abstracts Views on Vision4Press platform.
Data correspond to usage on the plateform after 2015. The current usage metrics is available 48-96 hours after online publication and is updated daily on week days.
Initial download of the metrics may take a while.