Free Access
Fig. 8
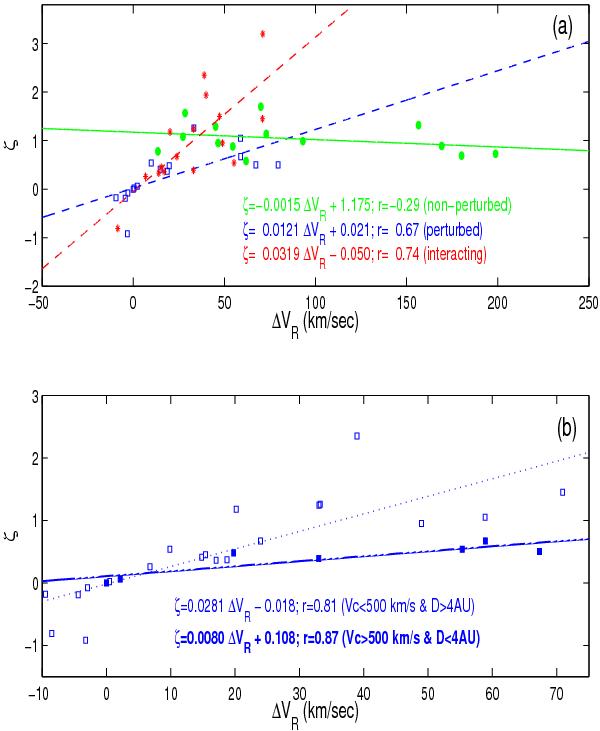
Perturbed and non-perturbed MCs have a remarkably different behavior of ζ when they are plotted as a function of ΔVR. The drawing convention is the same as that in Fig. 4 for panel a), while the perturbed MCs are grouped in terms of velocity and distance in panel b), as indicated by the legend.
Current usage metrics show cumulative count of Article Views (full-text article views including HTML views, PDF and ePub downloads, according to the available data) and Abstracts Views on Vision4Press platform.
Data correspond to usage on the plateform after 2015. The current usage metrics is available 48-96 hours after online publication and is updated daily on week days.
Initial download of the metrics may take a while.