Fig. 4
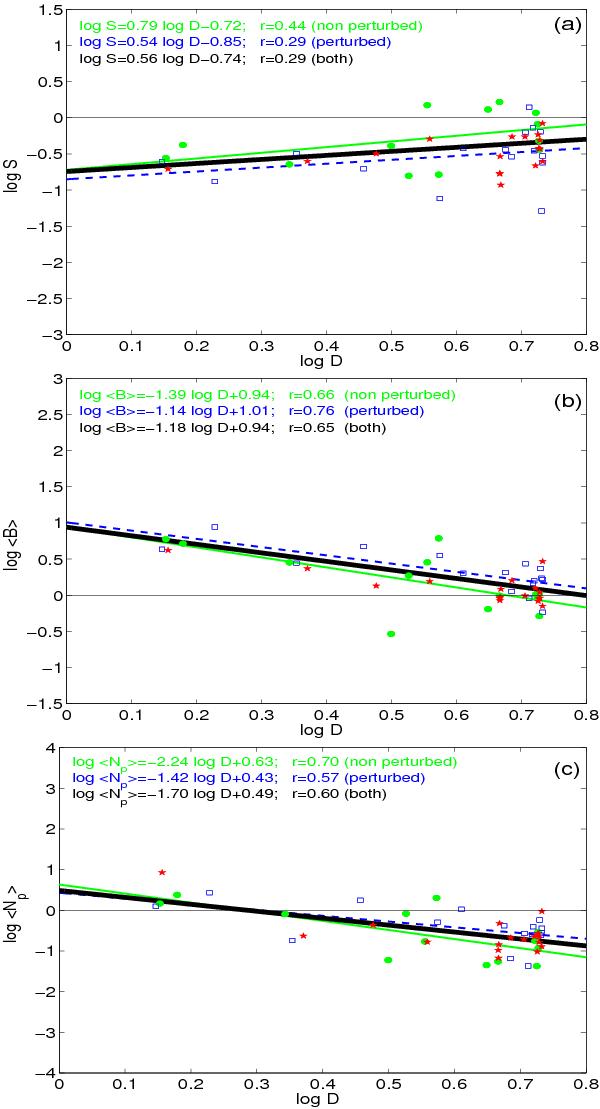
Dependence on the solar distance, D in AU, of a) the radial size in the  direction (AU), b) the mean magnetic field strength (nT), and c) the mean proton density (cm-3) with log-log plots. The MCs are separated in three groups: non-perturbed (filled green circles), perturbed (empty blue squares), and in interaction (red stars). The straight lines are the result of a least squares fit for non-perturbed (thin continuous green line), perturbed (dashed blue line), and for non-perturbed and perturbed MCs (thick continuous black line). The fits and the absolute value of the correlation coefficients, r, are added at the top of each panel.
Current usage metrics show cumulative count of Article Views (full-text article views including HTML views, PDF and ePub downloads, according to the available data) and Abstracts Views on Vision4Press platform.
Data correspond to usage on the plateform after 2015. The current usage metrics is available 48-96 hours after online publication and is updated daily on week days.
Initial download of the metrics may take a while.