Fig. 6
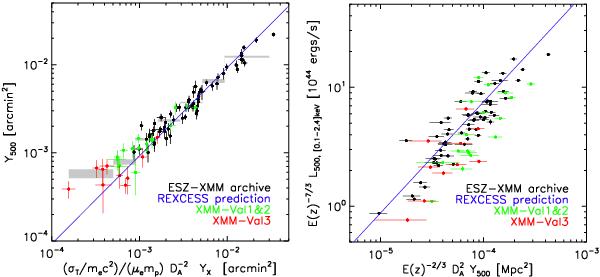
Scaling relations for the ten new confirmed clusters (red symbols). Black points show clusters in the Planck-ESZ sample with XMM-Newton archival data as presented in Planck Collaboration (2011e); green points represent previously-confirmed Planck clusters presented in Planck Collaboration (2011c). The blue lines denote the Y500 scaling relations predicted from the REXCESS X-ray observations (Arnaud et al. 2010). Left: relation between apparent SZ signal (Y500) and the corresponding normalised YX parameter. The grey area corresponds to weighted average Y500 values in YX bins with ±1σ errors. Right: relation between X-ray luminosity and Y500. For most data points, uncertainties on the luminosity are smaller than the point size.
Current usage metrics show cumulative count of Article Views (full-text article views including HTML views, PDF and ePub downloads, according to the available data) and Abstracts Views on Vision4Press platform.
Data correspond to usage on the plateform after 2015. The current usage metrics is available 48-96 hours after online publication and is updated daily on week days.
Initial download of the metrics may take a while.