Fig. 11
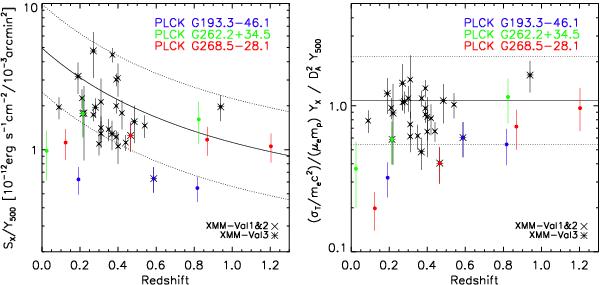
Variation with redshift of the ratio between the X-ray and SZ flux (left panel) and between YX and  (right panel). Line: locus established from scaling relations (Planck Collaboration 2011e; Arnaud et al. 2010). The dotted lines correspond to a factor of two above or below the mean relation. Black points: data for new Planck candidates confirmed with XMM-Newton. Colour points: data for clusters with ambiguous X-ray redshift estimates, one colour per cluster. Each point corresponds to one of the redshift solutions for an individual cluster, as derived from the χ2(z) minima (see Fig. 10).
Current usage metrics show cumulative count of Article Views (full-text article views including HTML views, PDF and ePub downloads, according to the available data) and Abstracts Views on Vision4Press platform.
Data correspond to usage on the plateform after 2015. The current usage metrics is available 48-96 hours after online publication and is updated daily on week days.
Initial download of the metrics may take a while.