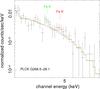
Fig. 10
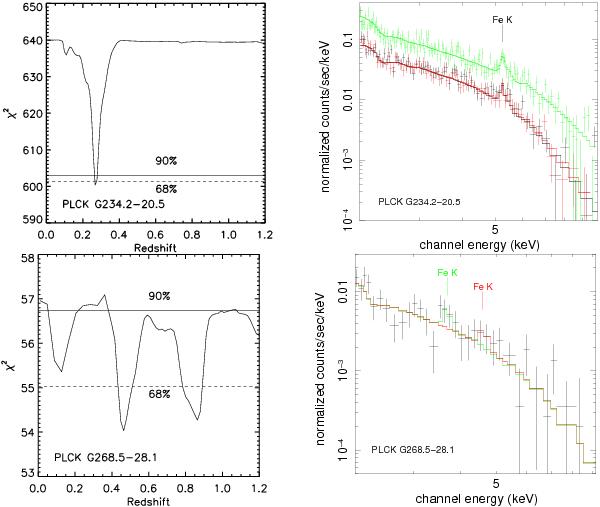
Redshift determination from XMM-Newton spectroscopy for the highest quality data (top row, PLCK G234.2 − 20.5) and lowest quality data (bottom row, PLCK G268.5-28) in the sample. Left panels: variation of χ2 with z when fitting the EPIC spectra, all other parameters being let free. The dashed and full lines correspond to the 68% and 90% error range, respectively. Right panels: EPIC spectra (data points with errors), together with the best-fitting model thermal model (solid lines) with the position of the redshifted Fe K line marked. Only the data points above 2 keV are shown for clarity, but data down to 0.3 keV are used in the spectral fitting. For PLCK G234.2-20.5 (top right panel), the Fe-K line complex is clearly detected in the EPIC MOS1&2 (red and black points) and pn (green points) spectra. For PLCK G268.5-28 (bottom right panel), only MOS data can be used (see Sect. 3.1) and the spectra are of poor statistical quality. The redshift estimate is ambiguous and the χ2 distribution (bottom left panel) shows several minima. The MOS1&2 spectra, summed for clarity, are compared to the best fitting model for z = 0.47 (red line) and z = 0.86 (green line), corresponding to the two lowest minima.
Current usage metrics show cumulative count of Article Views (full-text article views including HTML views, PDF and ePub downloads, according to the available data) and Abstracts Views on Vision4Press platform.
Data correspond to usage on the plateform after 2015. The current usage metrics is available 48-96 hours after online publication and is updated daily on week days.
Initial download of the metrics may take a while.