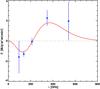
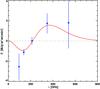
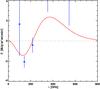
Fig. 1
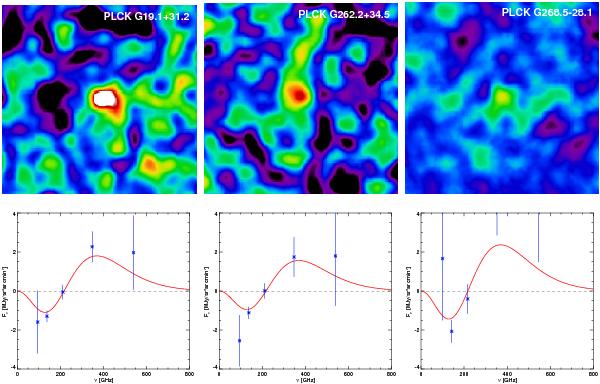
Illustration of the three SZ quality grades as defined in Sect. 2. From left to right the three quality cases are: QSZ = A,B,C. The top row shows a 100′ × 100′ SZ map with a spatial resolution of 10′, centred on the candidate position, derived using the MILCA reconstruction method (Hurier et al. 2010). The colour table is identical for all clusters, with the Compton y parameter spanning the range [ − 3 × 10-6,1 × 10-5] . The bottom row shows the associated SZ spectrum from aperture photometry measurements within R500 (see text for details). The red line is the SZ spectrum normalised to the Y500 value obtained from MMF blind detection.
Current usage metrics show cumulative count of Article Views (full-text article views including HTML views, PDF and ePub downloads, according to the available data) and Abstracts Views on Vision4Press platform.
Data correspond to usage on the plateform after 2015. The current usage metrics is available 48-96 hours after online publication and is updated daily on week days.
Initial download of the metrics may take a while.