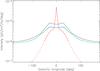
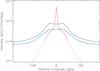
Fig. 6
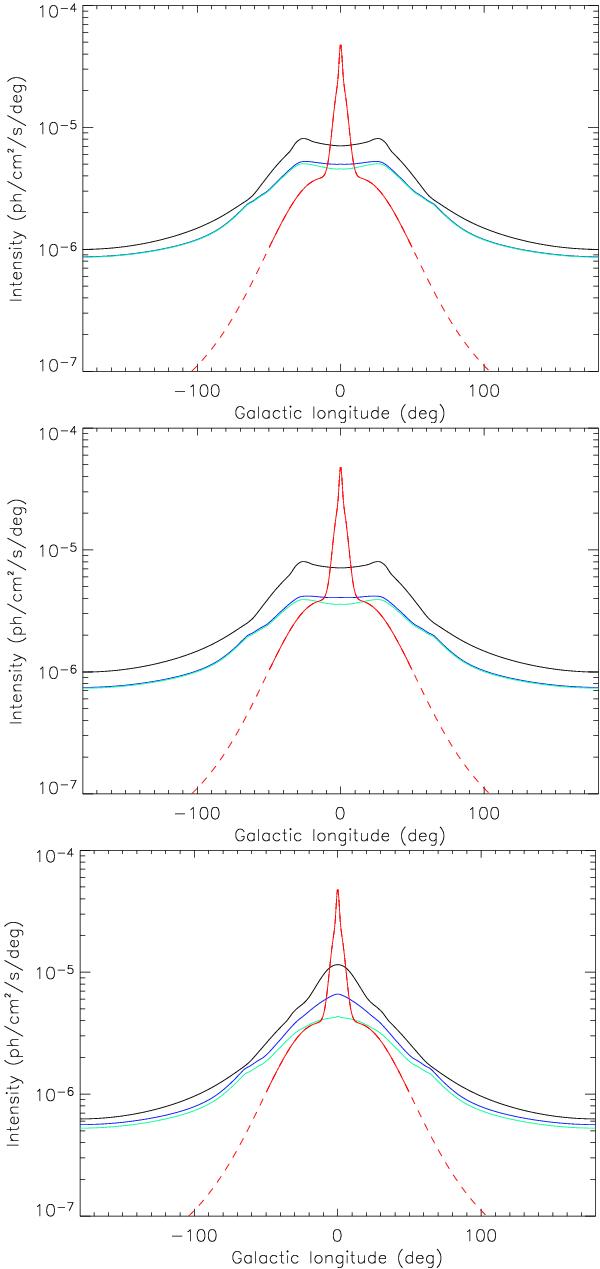
Longitude profiles of the 511 keV emission from 26Al, 44Ti, and 56Ni positrons (top, middle, and bottom panel respectively). Black, blue, and green curves correspond to transport configuration A, B, and C respectively. The red curves are the profile of a 511 keV sky model obtained from model-fitting to the INTEGRAL/SPI observations (the dashed part representing the longitude range over which the intensity is poorly constrained). The given intensities correspond to parapositronium annihilation only and were normalised to a positron injection rate of 1043 e+/s, with a positronium fraction of 0.95. The profiles were integrated over a π/9 rad latitude band centred on the Galactic plane.
Current usage metrics show cumulative count of Article Views (full-text article views including HTML views, PDF and ePub downloads, according to the available data) and Abstracts Views on Vision4Press platform.
Data correspond to usage on the plateform after 2015. The current usage metrics is available 48-96 hours after online publication and is updated daily on week days.
Initial download of the metrics may take a while.