Fig. 3
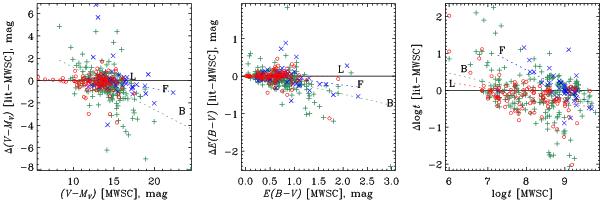
Comparison of distance moduli (left panel), reddenings (middle panel), and ages (right panel) derived with literature data. Optical data (Loktin et al. 2001; Loktin 2004, priv. comm.) are shown by red circles, the NIR data are marked by blue crosses (Froebrich et al. 2010) and green plusses (Bukowiecki et al. 2011). The dotted lines labelled L (Loktin), F (Froebrich), and B (Bukowiecki) are the corresponding fitted linear regressions (see Table 3 for their parameters).
Current usage metrics show cumulative count of Article Views (full-text article views including HTML views, PDF and ePub downloads, according to the available data) and Abstracts Views on Vision4Press platform.
Data correspond to usage on the plateform after 2015. The current usage metrics is available 48-96 hours after online publication and is updated daily on week days.
Initial download of the metrics may take a while.