Fig. 4
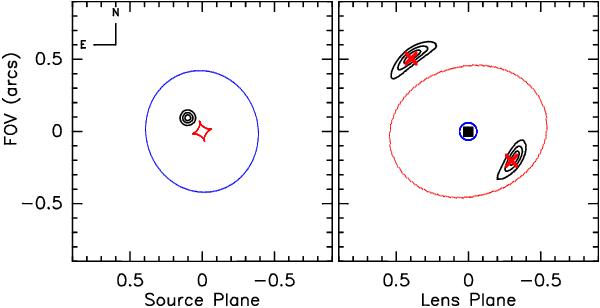
Lensing model of BRI 0952-0115. Left panel: the lens galaxy (at z = 0.632) is located at the center of the image. The black contours represent the BRI 0952-0115 position required to match optical observations. The mass distribution of the source is described in terms of a circular Gaussian function with FWHM ~ 0.07′′. The red curves around the position of the lens denote the tangential caustic, while the blue ellipse shows the radial caustic. Right panel: resulting image configuration and critical lines in the lens plane. The source is strongly lensed by the foreground galaxy and mapped onto a set of double images: the black contours represent the lensed images of BRI 0952-0115. Red crosses represent the relative position of A and B from the lensing galaxy location (filled red square), as measured by Lehár et al. (2000) in the optical images. Contour levels are shown at 20%, 50%, and 80% of the peak.
Current usage metrics show cumulative count of Article Views (full-text article views including HTML views, PDF and ePub downloads, according to the available data) and Abstracts Views on Vision4Press platform.
Data correspond to usage on the plateform after 2015. The current usage metrics is available 48-96 hours after online publication and is updated daily on week days.
Initial download of the metrics may take a while.