Fig. 3
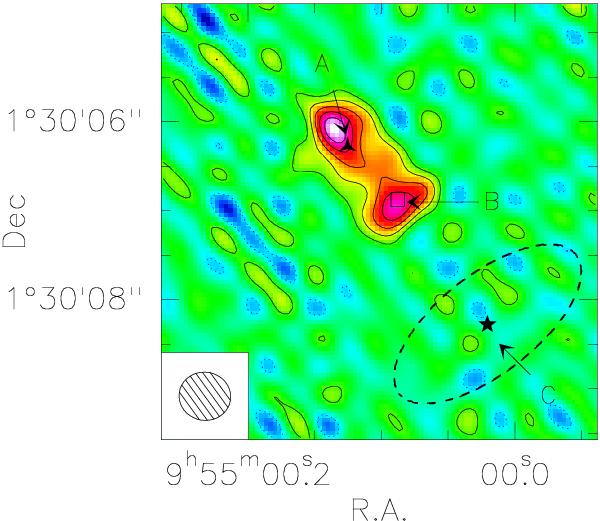
Map of the [CII] emission of BRI 0952-0115 obtained with an inverted Gaussian uv-taper to achieve an angular resolution of 0.5′′ × 0.5′′. Contour levels are shown in steps of 1σ = 0.8 Jy km s-1 beam-1. Negative contour levels at 1σ are shown with dotted lines. The filled three-points star, empty square, filled five-points star, and the dashed ellipse have the same meaning as in the left panel of Fig. 1.
Current usage metrics show cumulative count of Article Views (full-text article views including HTML views, PDF and ePub downloads, according to the available data) and Abstracts Views on Vision4Press platform.
Data correspond to usage on the plateform after 2015. The current usage metrics is available 48-96 hours after online publication and is updated daily on week days.
Initial download of the metrics may take a while.