Fig. 3
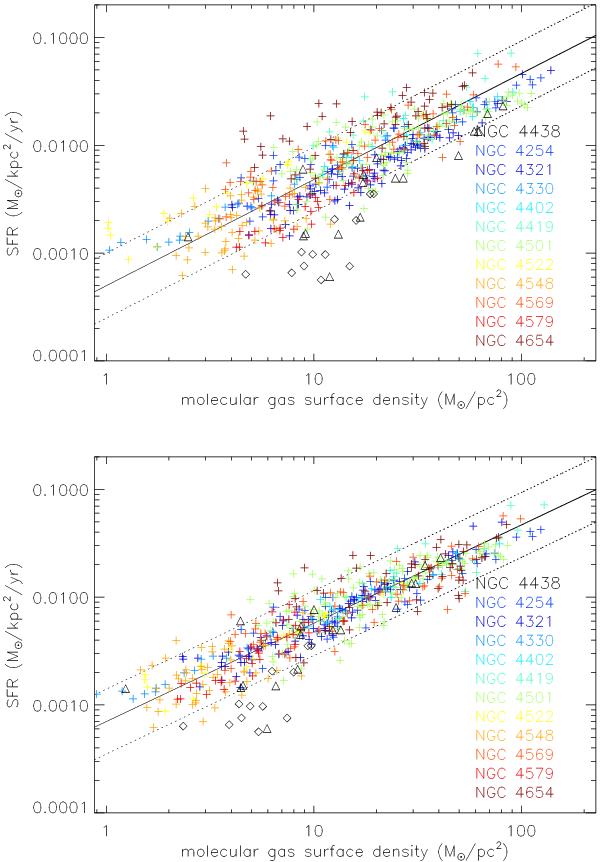
Star formation rate as a function of the molecular gas surface density for all sample galaxies. Upper panel: data with a constant CO-to-H2 conversion factor. Lower panel: with normalized molecular gas surface densities (see text). The solid lines represent a linear regression using a Bayesian approach to linear regression with errors in both variables (Kelly 2007). To guide the eye, the dotted lines represent offsets of a factor of two. Triangles represent data points within the disk of NGC 4438 (RA offset > − 20″), diamonds points in the western extraplanar region (RA offset ≤ − 20″; see Fig. 8).
Current usage metrics show cumulative count of Article Views (full-text article views including HTML views, PDF and ePub downloads, according to the available data) and Abstracts Views on Vision4Press platform.
Data correspond to usage on the plateform after 2015. The current usage metrics is available 48-96 hours after online publication and is updated daily on week days.
Initial download of the metrics may take a while.