Free Access
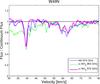
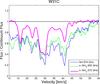
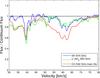
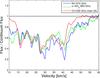
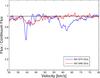
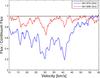
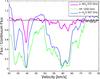
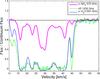
Fig. G.9

Comparison of absorption lines towards W49N and G10.6−0.4. The intensities have been normalised to single sideband continuum. An NO emission line from the source (952.464 GHz) has been removed from the o-NH2 spectrum (see Sect. B.)
This figure is made of several images, please see below:
Current usage metrics show cumulative count of Article Views (full-text article views including HTML views, PDF and ePub downloads, according to the available data) and Abstracts Views on Vision4Press platform.
Data correspond to usage on the plateform after 2015. The current usage metrics is available 48-96 hours after online publication and is updated daily on week days.
Initial download of the metrics may take a while.