Free Access
Fig. 8
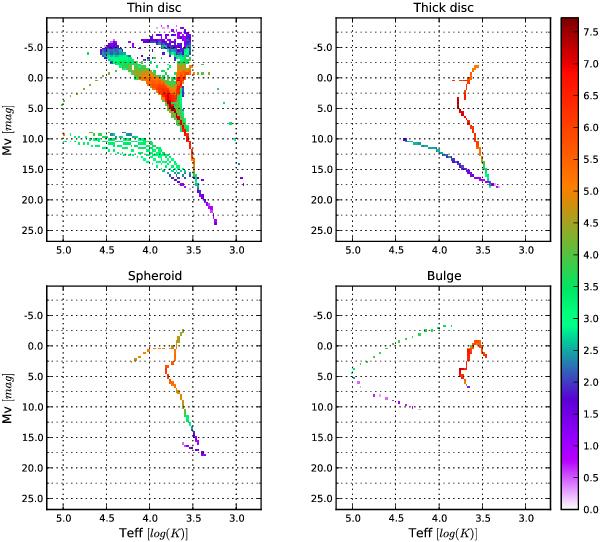
HR Diagram of stars split by population (left to right, top down): thin disc, thick disc, spheroid and bulge. colour scale indicates the log 10 of the number of stars per 0.025  and 0.37 mag.
Current usage metrics show cumulative count of Article Views (full-text article views including HTML views, PDF and ePub downloads, according to the available data) and Abstracts Views on Vision4Press platform.
Data correspond to usage on the plateform after 2015. The current usage metrics is available 48-96 hours after online publication and is updated daily on week days.
Initial download of the metrics may take a while.