Fig. 7
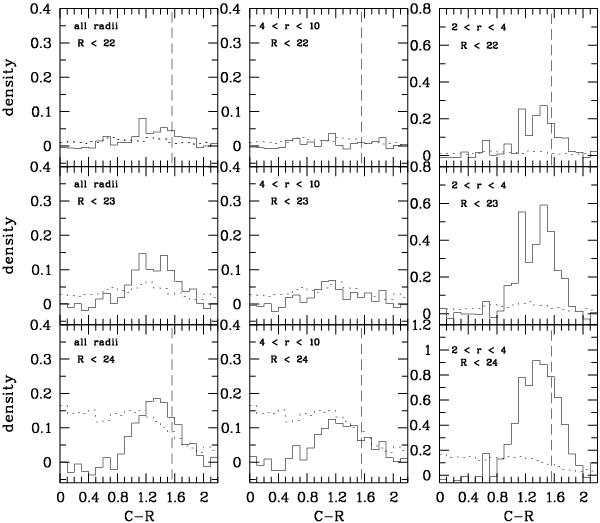
Color histograms, corrected for background counts, for three radial regimes and for different magnitude ranges. Left panel: 0–10 arcmin, middle panel: 4–10 arcmin, right panel: 2–4 arcmin. The upper row displays magnitudes brighter than R = 22, the middle row objects brighter than R = 23, the lower row objects brighter than R = 24. The respective backgrounds are indicated by the dotted histograms. The vertical dashed line indicates the color of NGC 1316 at 2′, outside the dusty region.
Current usage metrics show cumulative count of Article Views (full-text article views including HTML views, PDF and ePub downloads, according to the available data) and Abstracts Views on Vision4Press platform.
Data correspond to usage on the plateform after 2015. The current usage metrics is available 48-96 hours after online publication and is updated daily on week days.
Initial download of the metrics may take a while.