Fig. 6
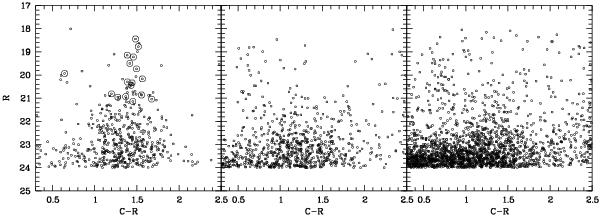
The three CMDs refer to different radius selections. The left panel shows GC candidates within the inner 4′, the middle panel between 4′ and 10′, and the outer panel at radii larger than 10′. The respective area sizes then are related as 1:5.2:25.3. The inner CMD is thus dominated by genuine GCs. In the left panel, spectroscopically confirmed GCs (Goudfrooij et al. 2001b) are marked. Note the blue object at C − R = 0.64, which must be a quite young cluster.
Current usage metrics show cumulative count of Article Views (full-text article views including HTML views, PDF and ePub downloads, according to the available data) and Abstracts Views on Vision4Press platform.
Data correspond to usage on the plateform after 2015. The current usage metrics is available 48-96 hours after online publication and is updated daily on week days.
Initial download of the metrics may take a while.