Fig. 15
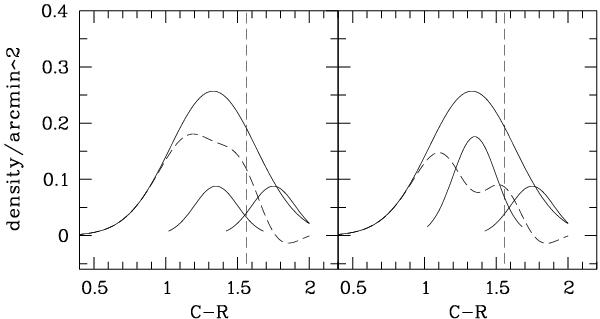
In both panels, the broad Gaussian (solid line) represents the color distribution of the entire GCS. The two narrower Gaussians represent the assumed bimodality of old metal-poor and metal-rich clusters. The dashed line results from subtracting the bimodal color distribution. In the left panel (case 1), intermediate-age clusters dominate, in the right panel (case 2), old clusters dominate. Case 2 is less consistent with the properties of the GC population.
Current usage metrics show cumulative count of Article Views (full-text article views including HTML views, PDF and ePub downloads, according to the available data) and Abstracts Views on Vision4Press platform.
Data correspond to usage on the plateform after 2015. The current usage metrics is available 48-96 hours after online publication and is updated daily on week days.
Initial download of the metrics may take a while.