Fig. 11
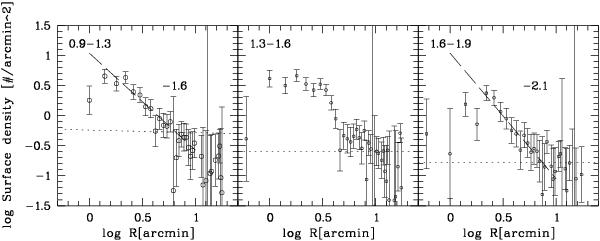
Surface densities in double-logarithmic display for point sources with the background subtracted and for three different C − R color intervals: 0.9–1.3 (left panel), 1.3–1.6 (middle panel),1.6–1.9 (right panel). For the blue and the red samples, the power-law indices, valid for the radial range between log(r) = 0.4 and log(r) = 0.9 are indicated. There is no uniform power-law for the intermediate sample. The dashed horizontal lines indicate the backgrounds. The vertical line is an excessively large uncertainty in one bin. Evidently, the inflection point in Fig. 8 is caused by the intermediate sample, which sharply falls off at a distance of 4.5′. We identify this sample with the bulk of intermediate-age clusters.
Current usage metrics show cumulative count of Article Views (full-text article views including HTML views, PDF and ePub downloads, according to the available data) and Abstracts Views on Vision4Press platform.
Data correspond to usage on the plateform after 2015. The current usage metrics is available 48-96 hours after online publication and is updated daily on week days.
Initial download of the metrics may take a while.