Free Access
Fig. 10
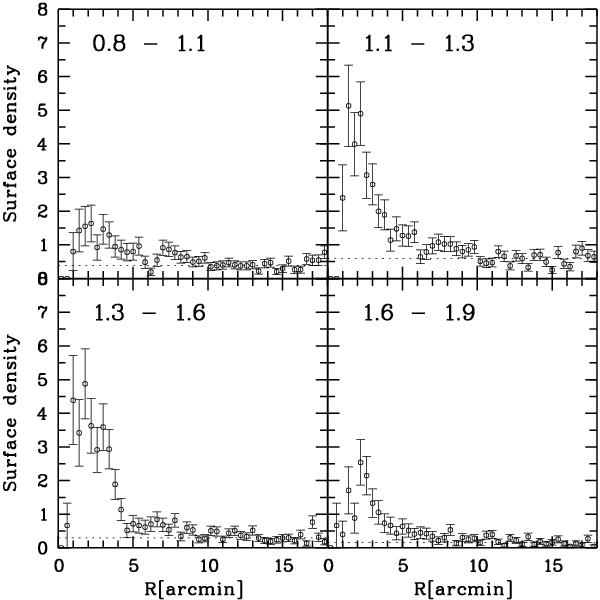
Background-subtracted surface densities for selected point sources in different C − R color intervals displayed linearly. See Sect. 5.2 for the significance of these intervals and Fig. 11 for a logarithmic display. Although only a poor population, clusters bluer than 1.1 are statistically well visible.
Current usage metrics show cumulative count of Article Views (full-text article views including HTML views, PDF and ePub downloads, according to the available data) and Abstracts Views on Vision4Press platform.
Data correspond to usage on the plateform after 2015. The current usage metrics is available 48-96 hours after online publication and is updated daily on week days.
Initial download of the metrics may take a while.