Fig. 8
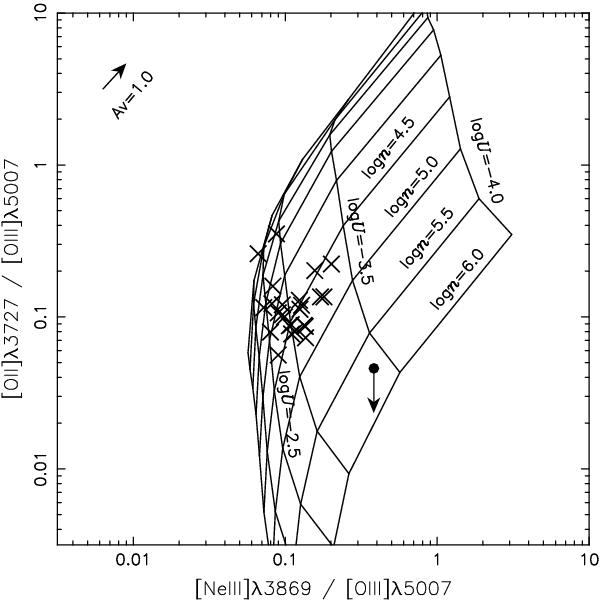
Emission-line flux ratios of [O ii]λ3727/[O iii]λ5007 versus [Ne iii]λ3869/[O iii]λ5007. The filled circle with an arrow denotes the data of SDSS J1707+6443 (where the 3σ upper limit is adopted for the [O ii] flux), and cross symbols denote the data of the SDSS low-z (z ~ 0.7) type 1 quasars. The arrow at the upper-left corner in the panel is the reddening vector for observed data in the case of AV = 1.0 mag, adopting the extinction curve of Cardelli et al. (1989). The grids are predicted emission-line flux ratios from Cloudy model runs, adopting ZNLR = 3 Z⊙ and varying the hydrogen density and the ionization parameter.
Current usage metrics show cumulative count of Article Views (full-text article views including HTML views, PDF and ePub downloads, according to the available data) and Abstracts Views on Vision4Press platform.
Data correspond to usage on the plateform after 2015. The current usage metrics is available 48-96 hours after online publication and is updated daily on week days.
Initial download of the metrics may take a while.