Fig. 7
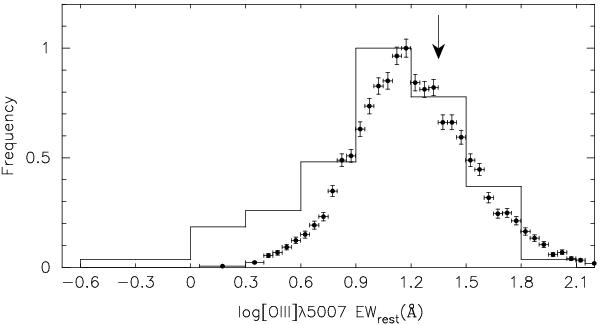
Solid-line histogram denotes the compiled data of high-z type 1 quasars from the literature (McIntosh et al. 1999; Netzer et al. 2004; Marziani et al. 2009; Greene et al. 2010). Filled circles with error bars denote the data of SDSS type 1 quasars at 0 < z < 1 (Risaliti et al. 2011). The frequency distributions of the two datasets are normalized by the number of objects in the bin at the peak of their frequency distributions. The arrow denotes the EWrest([O iii]) value of SDSS J1707+6443 measured in our work.
Current usage metrics show cumulative count of Article Views (full-text article views including HTML views, PDF and ePub downloads, according to the available data) and Abstracts Views on Vision4Press platform.
Data correspond to usage on the plateform after 2015. The current usage metrics is available 48-96 hours after online publication and is updated daily on week days.
Initial download of the metrics may take a while.