Fig. 1
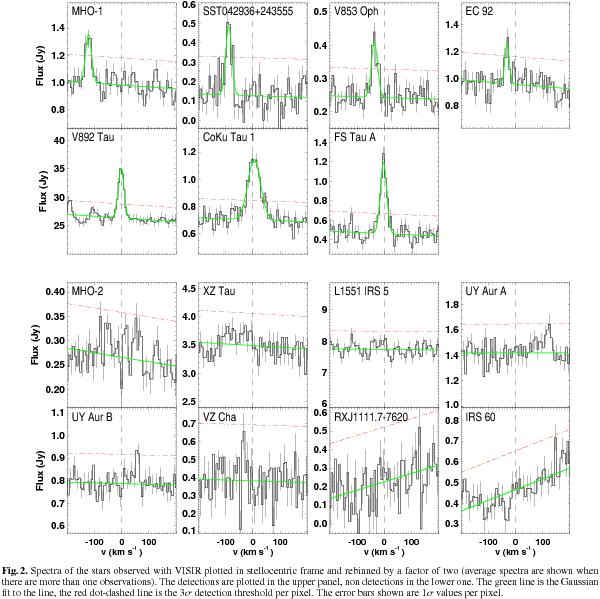
Spectra of the stars observed with VISIR plotted in stellocentric frame and rebinned by a factor of two (average spectra are shown when there are more than one observations). The detections are plotted in the upper panel, non detections in the lower one. The green line is the Gaussian fit to the line, the red dot-dashed line is the 3σ detection threshold per pixel. The error bars shown are 1σ values per pixel.
Current usage metrics show cumulative count of Article Views (full-text article views including HTML views, PDF and ePub downloads, according to the available data) and Abstracts Views on Vision4Press platform.
Data correspond to usage on the plateform after 2015. The current usage metrics is available 48-96 hours after online publication and is updated daily on week days.
Initial download of the metrics may take a while.