Fig. 9
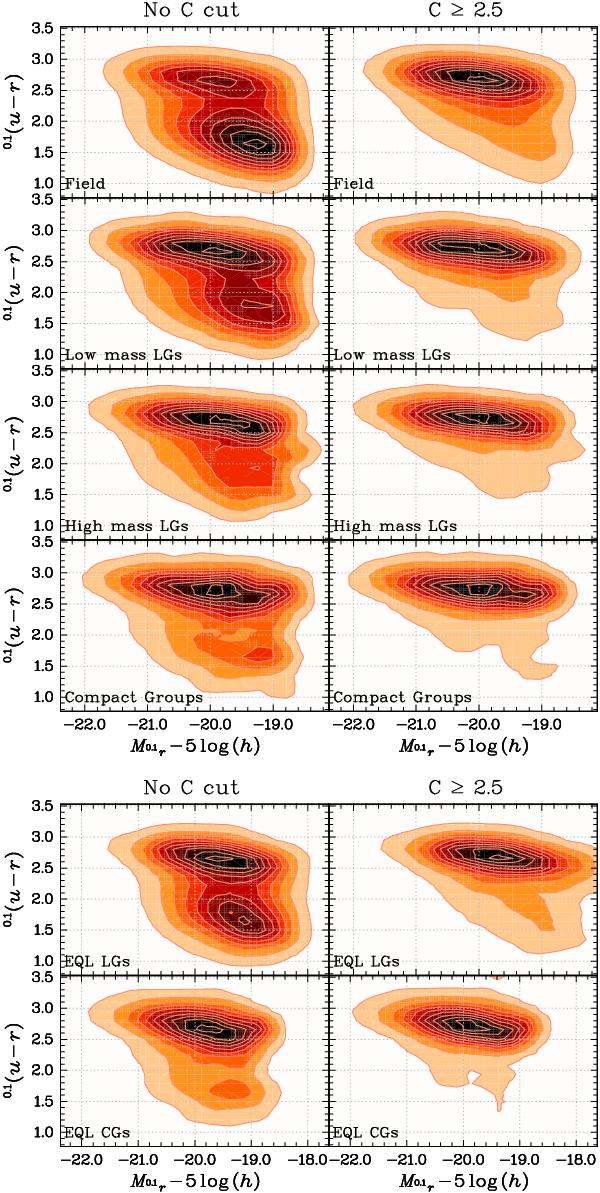
Colour − magnitude diagram: 0.1(u − r) as a function of  for galaxies in the field, in both low and high mass LGs, and in CGs. Equal luminosity samples of CGs and LGs are shown separately. Left panels include all galaxies in the samples, while right panels include only early-type galaxies according to their concentration parameter. Darker colours represent higher values. All distributions have been normalised to enclose the same volume.
Current usage metrics show cumulative count of Article Views (full-text article views including HTML views, PDF and ePub downloads, according to the available data) and Abstracts Views on Vision4Press platform.
Data correspond to usage on the plateform after 2015. The current usage metrics is available 48-96 hours after online publication and is updated daily on week days.
Initial download of the metrics may take a while.