Free Access
Fig. 4
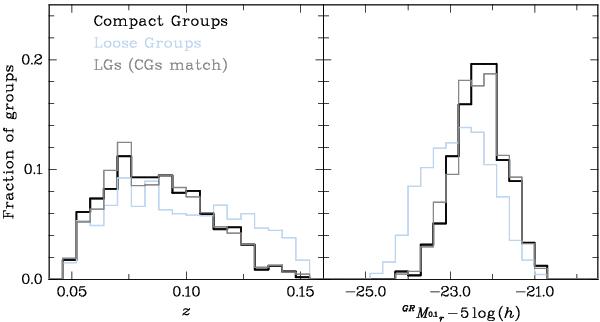
Redshift (left panel) and total group absolute magnitude (right panel) distributions of groups in the region defined in Fig. 3: CGs (black), LGs (light blue) and LGs selected by a Monte Carlo algorithm to ensure that their redshift, and absolute magnitude distributions are similar to those of the CGs (grey).
Current usage metrics show cumulative count of Article Views (full-text article views including HTML views, PDF and ePub downloads, according to the available data) and Abstracts Views on Vision4Press platform.
Data correspond to usage on the plateform after 2015. The current usage metrics is available 48-96 hours after online publication and is updated daily on week days.
Initial download of the metrics may take a while.