Fig. 1
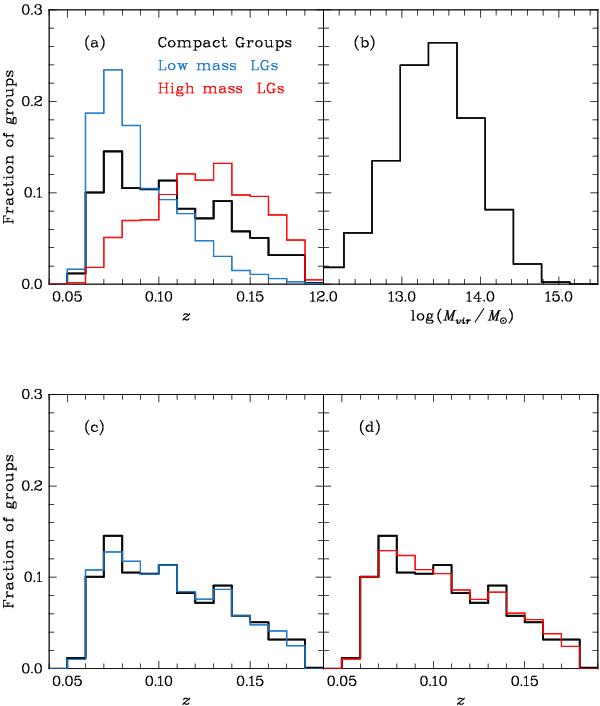
Panel a) shows the spectroscopic redshift distribution of our samples of CGs (black line), and LGs with Ngal ≤ 6 in two ranges of virial mass: low mass (blue line) and high mass (red line). Panel b) shows the virial mass distribution of LGs groups with Ngal ≤ 6 and 0.06 ≤ z ≤ 0.18. Panels c) and d) show the CG redshift distribution (black line), and the low-mass (blue line) and high-mass (red line) subsamples of LGs restricted to have redshift distributions similar to that of the CGs by using a Monte Carlo algorithm (see text for details).
Current usage metrics show cumulative count of Article Views (full-text article views including HTML views, PDF and ePub downloads, according to the available data) and Abstracts Views on Vision4Press platform.
Data correspond to usage on the plateform after 2015. The current usage metrics is available 48-96 hours after online publication and is updated daily on week days.
Initial download of the metrics may take a while.