Free Access
Fig. 5
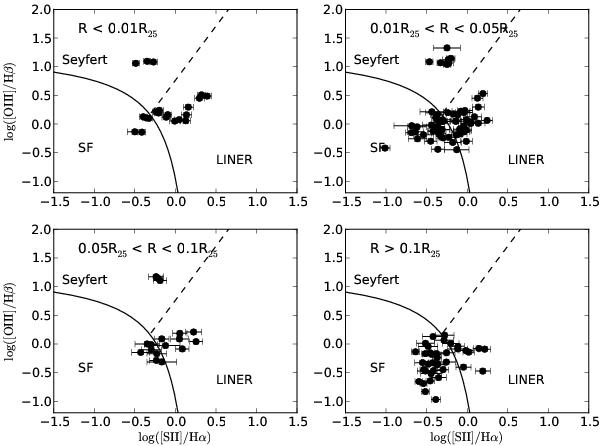
Diagnostic diagram for the emission-line regions of run1 galaxies for different galactocentric distances (R) scaled with R25. The solid line delineates our adopted separation between star formation regions and AGNs; below the dashed line there are LINERs and above it Seyferts (Kewley et al. 2006).
Current usage metrics show cumulative count of Article Views (full-text article views including HTML views, PDF and ePub downloads, according to the available data) and Abstracts Views on Vision4Press platform.
Data correspond to usage on the plateform after 2015. The current usage metrics is available 48-96 hours after online publication and is updated daily on week days.
Initial download of the metrics may take a while.