Fig. 4
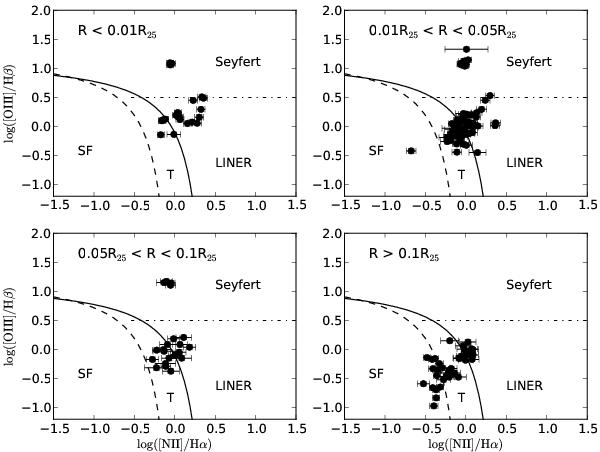
Diagnostic diagram for the emission-line regions of run1 galaxies at different galactocentric distances (R) scaled with R25. The solid line (Kewley et al. 2001) sets the star formation upper limit, the dashed line (Kauffmann et al. 2003) the empirical division between star-forming galaxies (SF) and transition objects (T), and the horizontal line (Kewley et al. 2006) separates Seyferts and Low-Ionization Nuclear Emission-line Regions (LINERs).
Current usage metrics show cumulative count of Article Views (full-text article views including HTML views, PDF and ePub downloads, according to the available data) and Abstracts Views on Vision4Press platform.
Data correspond to usage on the plateform after 2015. The current usage metrics is available 48-96 hours after online publication and is updated daily on week days.
Initial download of the metrics may take a while.