Free Access
Fig. 1
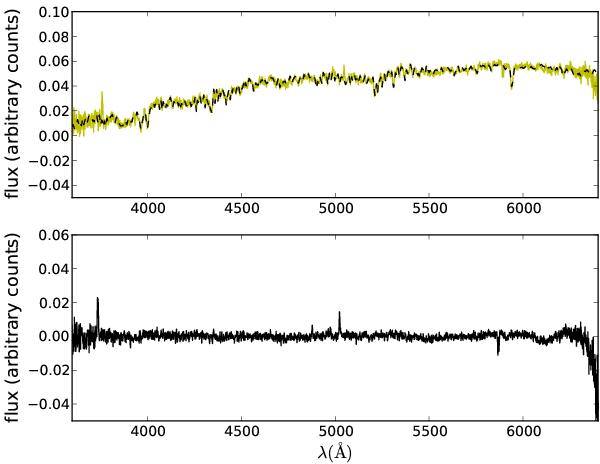
Central spectrum for NGC 1169 (from run2). The top panel shows the observed spectrum (yellow line) and the fitted template (black line). Bottom panel shows the residuals from the fit. Oxygen and Hβ lines are clearly visible.
Current usage metrics show cumulative count of Article Views (full-text article views including HTML views, PDF and ePub downloads, according to the available data) and Abstracts Views on Vision4Press platform.
Data correspond to usage on the plateform after 2015. The current usage metrics is available 48-96 hours after online publication and is updated daily on week days.
Initial download of the metrics may take a while.