Fig. 6
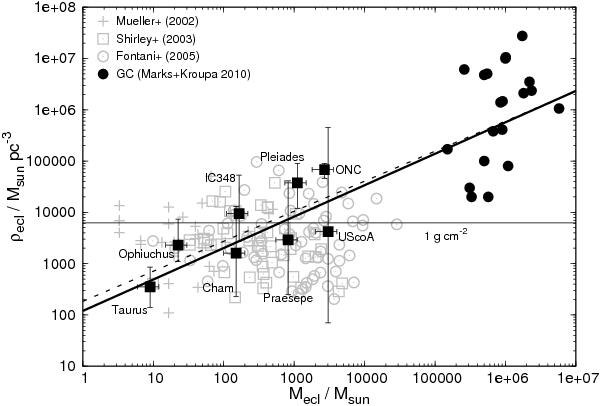
Constraints on the initial volume-densities within the half-mass radius and masses derived in this work for the seven clusters (filled squares) versus the initial stellar mass. The indicated errors in mass correspond to the observationally inferred present-day mass on the left end of a bar and two times the present-day mass on its right end, to be understood as an estimator of the possible initial-mass range. Filled circles are Galactic GCs as in Fig. 5. Underlaid as grey symbols are data of molecular cloud clumps of Mueller et al. (2002, crosses), Shirley et al. (2003, squares), and Fontani et al. (2005, circles) as collated by Parmentier & Kroupa (2011). These are known to have already begun forming stars. The clump masses have been multiplied with a star-formation efficiency of one-third to compare to the stellar masses and densities inferred in the present work. The thin solid black-line is the threshold for massive-star formation evaluated by Krumholz & McKee (2008, 1 g cm-2. The thick solid black-line is a least squares fit to both the young cluster and GC data (Eq. (6)), implying that there is a mass-radius relation (Eq. (7)) for star cluster-forming cloud clumps. The dashed line shows the result when the GCs are excluded from the fit.
Current usage metrics show cumulative count of Article Views (full-text article views including HTML views, PDF and ePub downloads, according to the available data) and Abstracts Views on Vision4Press platform.
Data correspond to usage on the plateform after 2015. The current usage metrics is available 48-96 hours after online publication and is updated daily on week days.
Initial download of the metrics may take a while.