Free Access
Fig. 3
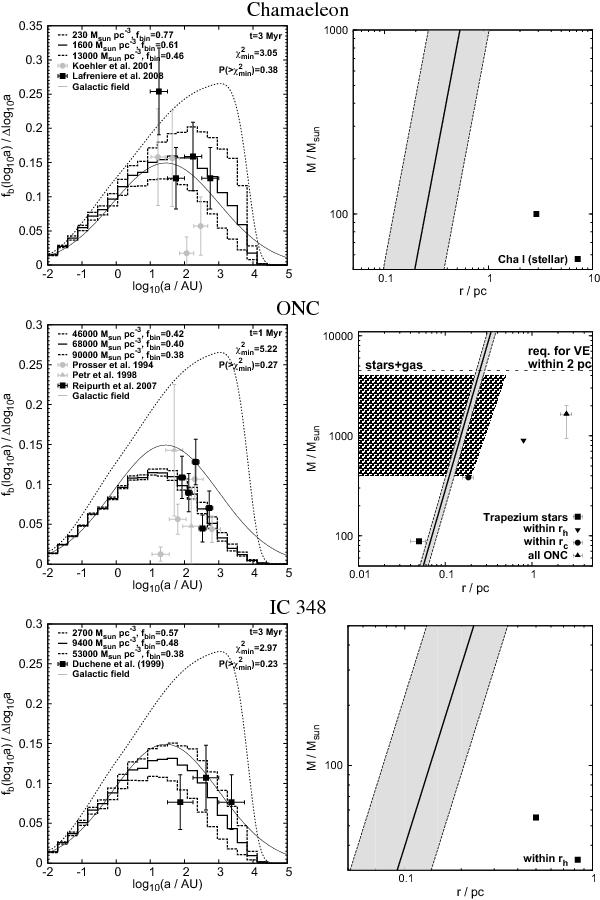
As Fig. 2, but for Chamaeleon, the ONC, and IC 348. The hashed area in the middle-right panel is an allowed region for initial masses and sizes of the ONC according to the expanding cluster models of Kroupa (2000, his Fig. 5).
Current usage metrics show cumulative count of Article Views (full-text article views including HTML views, PDF and ePub downloads, according to the available data) and Abstracts Views on Vision4Press platform.
Data correspond to usage on the plateform after 2015. The current usage metrics is available 48-96 hours after online publication and is updated daily on week days.
Initial download of the metrics may take a while.