Fig. 2
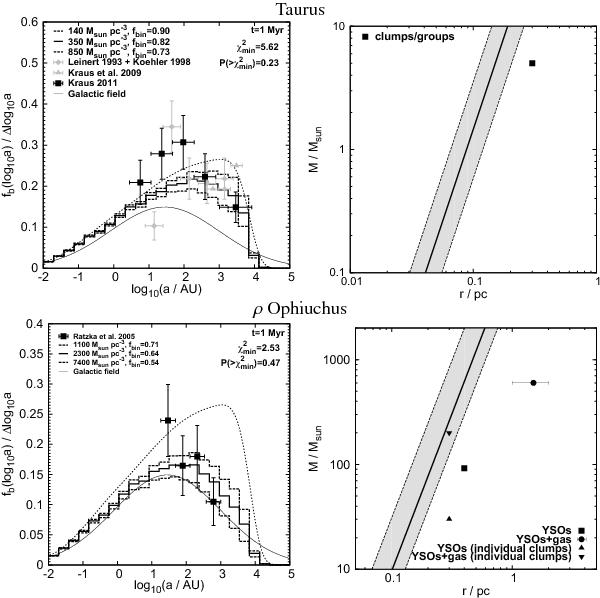
Left column: semi-major axis distribution functions. Both panels show the initial (Kroupa 1995b) semi-major axis distribution in star clusters (dashed curve), as well as the canonical solar-type Galactic field distribution (solid curve, Duquennoy & Mayor 1991). The black squares are observational data from the references given in the legend to which the model is fitted (in Figs. 2 − 4 corresponding to the most recent data or the largest sample). Vertical errorbars indicate  errors, the horizontal ones indicate the width of the bin. The initial semi-major axis distribution evolves into the solid histogram for an initial stellar density within the half-mass radius, ρecl, as indicated in the legends. The respective χ2-tests yield the indicated
  - and
- and  -values, if the initial distribution is evolved for the time t in a cluster of density ρecl (note that t is mostly an upper limit to the age of the population). The resulting distributions are likely parent functions for the observational data. The dashed histograms are 10 percent confidence limits, outside which a distribution would be rejected as a probable parent function with ≳ 90 percent confidence. The overall model binary-fraction, fbin (integrated over the whole semi-major axis range), is indicated in the legend. Right column: the thick solid and dashed lines are lines of constant volume density within the half-mass radius according to the best-fit ρecl and the confidence intervals, respectively. Thus, the model suggests that the total stellar mass and half-mass radius in a typical, dynamically active region (e.g. a sub-clump) of the star-forming environment’s progenitor lies somewhere in the grey shaded region. For comparison, observed present-day masses and spatial extensions are shown (Sect. 3). Note that the masses and sizes shown denote different spatial scales (e.g. the constant density lines depict the typical total stellar masses, Mecl, and the half-mass radius, rh, required to produce the present binary population, while the symbols might refer to different quantities as indicated in the legend – i.e. the total stellar+gas mass within the whole region, not solely individual clumps).
Current usage metrics show cumulative count of Article Views (full-text article views including HTML views, PDF and ePub downloads, according to the available data) and Abstracts Views on Vision4Press platform.
Data correspond to usage on the plateform after 2015. The current usage metrics is available 48-96 hours after online publication and is updated daily on week days.
Initial download of the metrics may take a while.