Fig. 6
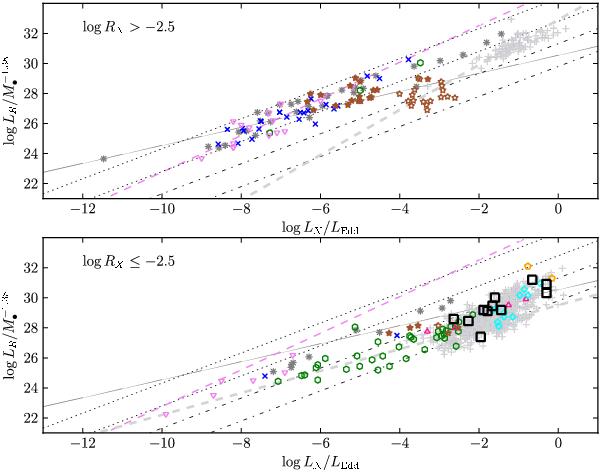
M• weighted 5 GHz radio luminosity versus the soft X-ray luminosity in units of the Eddington luminosity (from the fundamental plane equation in Merloni et al. 2003). Symbol shapes as in Fig. 5. For clarity, our data are presented as open black squares. In addition, we show the data of Merloni et al. (2003, gray asterisks) and the low-luminosity AGN of Yuan et al. (2009, violet, downpointing triangles). The dashed violet line represents the fit of Yuan et al. (2009) adopted to soft X-rays. The thin gray line shows the fundamental plane of Merloni et al. (2003) adopted for the soft X-rays. The thin black dotted (dot-dashed) lines indicate constant RX = −1.5 (RX = −4.5) for typical log M• [M⊙] = 6 and 10 (upper and lower line), respectively. These lines have a slope of unity. Furthermore, we present data from Hardcastle et al. (2009, stars), for which the fraction of accretion related X-ray emission could be determined. The brown-colored full stars correspond to the full X-ray and the brown open stars to the accretion-related X-ray luminosities. Upper panel: presented are RL objects, RX > − 2.5, according to Panessa et al. (2007). The thick, dashed light-gray line represents the fit of Li et al. (2008) to their RL BLAGN. Lower panel: presented are RQ objects, RX ≤ − 2.5, according to Panessa et al. (2007). The thick, dashed light-gray line represents the fit of Li et al. (2008) to their RQ BLAGN. See text for details.
Current usage metrics show cumulative count of Article Views (full-text article views including HTML views, PDF and ePub downloads, according to the available data) and Abstracts Views on Vision4Press platform.
Data correspond to usage on the plateform after 2015. The current usage metrics is available 48-96 hours after online publication and is updated daily on week days.
Initial download of the metrics may take a while.